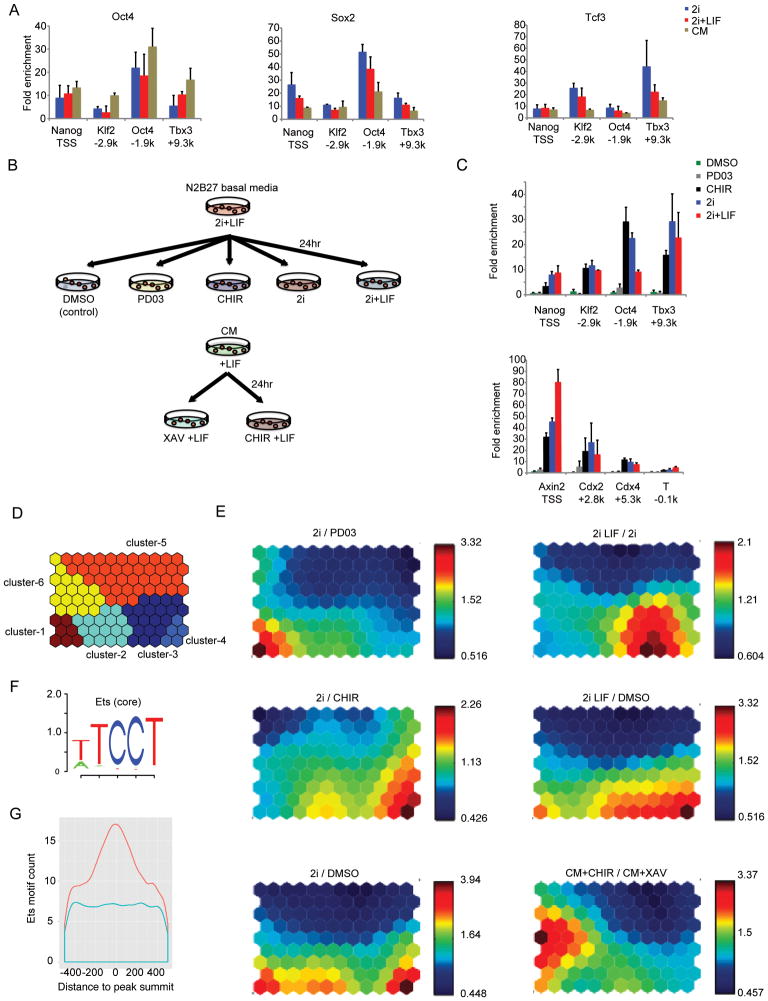
Figure 5. Roles of small molecules CHIR and PD03 in 2i.
(A) ChIP-qPCR for Oct4, Sox2 and Tcf3 interaction at defined regulatory regions surrounding pluripotency target genes in mESCs cultured in 2i, 2i+LIF, and CM. Data represent the mean of biological replicates.
(B) Experimental scheme for studying the role of CHIR and PD03 in CM and 2i-adapted mESCs. ChIP-qPCR and microarray analysis were performed in 2i-adapted mESCs cultured for 24 hours with DMSO (control), PD03, CHIR, 2i, and 2i+LIF. Cells at passage 20 under the 2i+LIF condition were subjected to each assay. Cells that had been maintained in CM on feeder cells were cultured for 24 hours in CM with CHIR or XAV prior to microarray analysis.
(C) ChIP-qPCR for β-catenin at selected loci near pluripotency-related genes (upper), differentiation-related and Wnt target genes (lower) on 2i-adapted mESCs. ChIP using anti-FLAG antibodies was performed according to the experimental scheme described in (B). Data show the mean and standard error of the mean (s.e.m.) for three biological replicates.
(D) K-means clustering was used to classify genes with expression fold change > 2 in at least one comparison group of 2i/PD03, 2i/CHIR, 2i/DMSO, 2iLIF/2i, 2iLIF/DMSO, and CM+CHIR/CM+XAV. A total of 388 genes were clustered into six clusters.
(E) Individual component maps are shown for each pair-wise comparison. Top left: 2i/PD03; middle left: 2i/CHIR; bottom left: 2i/DMSO; top right: 2iLIF/2i; middle right: 2iLIF/DMSO; bottom right: CM+CHIR/CM+XAV. In general, red indicates up-regulation and blue down-regulation. The number by each color bar is the actual number of fold change.
(F) Five bp core Ets motif logo TCCTW from TRANSFAC motif M00339.
(G) Enrichment of Ets core motif ± 500bp around β-catenin peak summit (orange) compared with matched control regions (blue).

