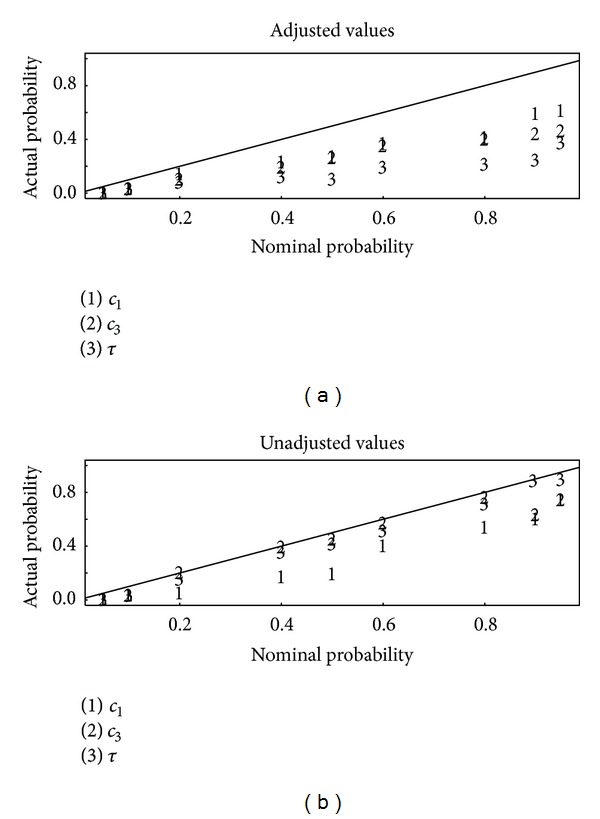
Figure 2.

Actual (estimated to within ±0.03 on the basis of 1000 replications of the simulation approach) coverage versus the nominal coverage for 95%, 90%, 80%, 60%, 50%, 40%, 20%, 10%, and 5% posterior intervals for each of the three parameters for each of the three sets of summary statistics, using the ridge-based adjustment (a) in abc or not using any adjustment (b). This plot is based on summary statistics set 1.
