
Figure 1.
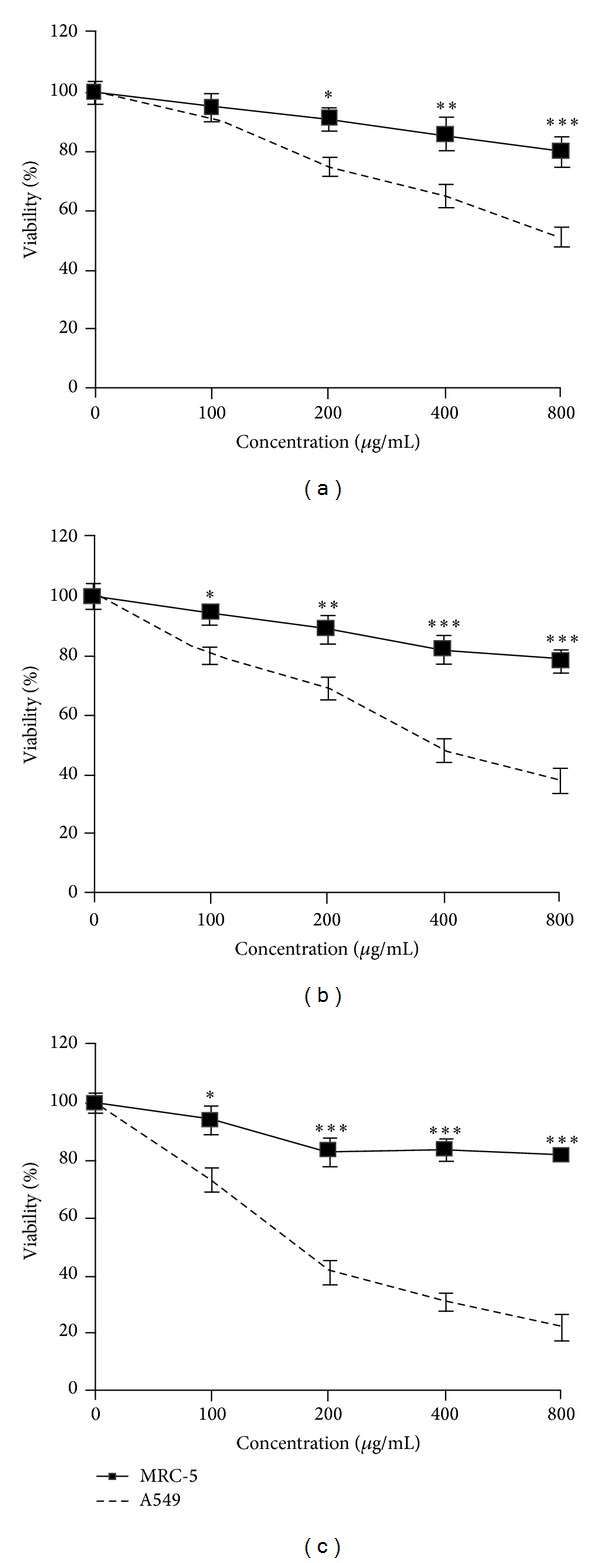
Exposure of the A549 cells for 24, 48, and 72 h with saffron. Cells were treated with different concentrations of saffron extract (100, 200, 400, and 800 μg/mL) for 24 (a), 48 (b), and 72 (c) hours. Viability was quantitated by MTT assay. Results are mean ± SEM. The asterisks are indicators of statistical difference obtained separately at different time points compared to their controls shown in figure as *P < 0.05, **P < 0.01, and ***P < 0.001.