Abstract
To examine the relationship between activated-sludge bulking and levels of specific filamentous bacteria, we developed a statistics-based quantification method for estimating the biomass levels of specific filaments using 16S rRNA-targeted fluorescent in situ hybridization (FISH) probes. The results of quantitative FISH for the filament Sphaerotilus natans were similar to the results of quantitative membrane hybridization in a sample from a full-scale wastewater treatment plant. Laboratory-scale reactors were operated under different flow conditions to develop bulking and nonbulking sludge and were bioaugmented with S. natans cells to stimulate bulking. Instead of S. natans, the filament Eikelboom type 1851 became dominant in the reactors. Levels of type 1851 filaments extending out of the flocs correlated strongly with the sludge volume index, and extended filament lengths of approximately 6 × 108 μm ml−1 resulted in bulking in laboratory-scale and full-scale activated-sludge samples. Quantitative FISH showed that high levels of filaments occurred inside the flocs in nonbulking sludge, supporting the “substrate diffusion limitation” hypothesis for bulking. The approach will allow the monitoring of incremental improvements in bulking control methods and the delineation of the operational conditions that lead to bulking due to specific filaments.
Filamentous bulking is caused by the excessive growth of various types of filamentous organisms that extend from flocs into the bulk solution and interfere with compaction, settling, thickening, and concentration of activated sludge (20). Over 25 different filament “types” in activated sludge have been “identified” to phenotype, primarily using morphology and staining characteristics (5, 13, 14). To circumvent the limitations of these techniques, rRNA-targeted oligonucleotide hybridization probes have been developed for the reliable identification of specific filamentous bacteria (see, e.g., references 3, 9, 10, 15, 22, and 30).
Understanding filamentous bulking also requires quantifying the levels of specific filaments and relating these levels to settling characteristics. Early work showed that the sludge volume index (SVI) of activated sludge could be related to the total filament length per floc (16). The total extended filament length in activated sludge has been shown to correlate with SVI, diluted SVI, and zone settling velocity (20, 26, 28) and the parameter n of the activated-sludge exponential-settling model (8). However, these efforts were not filament specific; i.e., all filamentous types were included in the measurements, and the individual contribution of particular filamentous species or types remains unknown. Among other reasons, fluorescent in situ hybridization (FISH) is the most appropriate molecular method for such quantification because it can be used to directly measure cell dimension, which is relevant in phenomena such as bulking.
A quantitative FISH technique for estimating the biomass levels of foam-forming Gordonia spp. was previously developed (11) and used to monitor the populations of foam formers before and after an incident of foaming in a full-scale plant (12). A statistically robust quantitative FISH technique for examining mycolata was described by Davenport et al. (9).
The objective of the present study was to develop a statistically valid FISH method to quantify the contribution of specific filamentous species to bulking and to show how this approach can be used to track changes in filament levels as an activated-sludge reactor begins to experience bulking. The quantitative FISH procedure in the present study was tested on two filaments for which pure cultures are available, Sphaerotilus natans and Leucothrix mucor, and on Eikelboom type 1851, which is not available in pure culture. For S. natans, the biomass levels determined by FISH were compared to the results of quantitative slot-blot hybridization with 32P-labeled probes. The quantitative FISH method was used on a full-scale activated-sludge sample and on samples from laboratory-scale reactors that were operated with and without bioaugmentation of S. natans cells. Laboratory-scale reactors were used since full-scale plants dominated by S. natans and L. mucor were not available. Two laboratory-scale reactors were operated with different flow conditions: a completely mixed reactor (CMR) that continuously experienced low substrate concentrations and a sequencing batch reactor (SBR) with fast fill. We hypothesized that the SBR configuration would provide a strong substrate gradient that would favor the floc-forming bacteria and thus minimize bulking in accordance with the kinetic selection theory (7). In contrast, the CMR would have low substrate concentrations within the reactor and would favor high-substrate-affinity filamentous bacteria. Tracking the levels of specific filaments in the bulking and nonbulking sludge reactors would then allow a quantitative comparison of the effect of filament levels on bulking.
MATERIALS AND METHODS
Organisms used and growth conditions.
Pure cultures of S. natans (ATCC 13395) and L. mucor (ATCC 25107) were grown in CYGA medium (containing, per liter, 5 g of Casitone, 10 g of glycerol, and 1 g of yeast autolysate) and ATCC medium 429 (containing, per liter, 11.7 g of NaCl, 5.35 g of MgCl2, 2 g of Na2SO4, 0.75 g of CaCl2 · 2H2O, 0.35 g of KCl, 0.5 g of Tris buffer, 0.05 g of Na2HPO4, and 10 g of sodium glutamate [pH 7.6]), respectively, at 26°C in a shaker operating at 100 rpm. For FISH, cells were harvested at stationary phase to simulate low growth rates in activated-sludge plants (11, 19).
Environmental samples. (i) Full-scale wastewater treatment plants.
Grab samples were obtained from the Greenville Wastewater Treatment Plant (WWTP) (Greenville, N.C.) activated-sludge mixed liquor in 50-ml tubes and sent overnight on ice to the laboratory. Grab samples from the North Cary Water Reclamation Facility (NCWRF) (Cary, N.C.) activated-sludge basin were obtained every week from February to September 2002. Samples (3 ml) were fixed using 9 ml of 4% (wt/vol) paraformaldehyde for 2 h at 4°C, washed twice with phosphate-buffered saline (PBS), and stored in PBS-ethanol (1:1, vol/vol) at −20°C until used for FISH. For membrane hybridizations, 14-ml samples were centrifuged at 2,000 × g and cell pellets were stored at −80°C until nucleic acid extraction.
(ii) Laboratory-scale reactors.
Two batch scale reactors (effective volume of 8 liters each) were used. One was operated as a CMR with biomass recycle via a conical glass clarifier, and the other was operated as an SBR. Flows were controlled with peristaltic pumps (Cole-Parmer, Vernon Hills, Ill.), and periods for feeding, mixing, aerating, settling, and discharging for the SBR were set by time controllers (ChronTrol Corp. San Diego, Calif.). Dissolved oxygen was measured using a YSI 5100 dissolved-oxygen meter (Yellow Springs Instrument Co., Yellow Springs, Ohio). The temperature was maintained at 22 ± 1°C.
SVI, dissolved oxygen, chemical oxygen demand, mixed-liquor suspended solids, mixed-liquor volatile suspended solids (VSS), total nitrogen, and total phosphorus were measured periodically as described in Standard Methods (18). The reactors treated synthetic wastewater with a chemical oxygen demand, total nitrogen and total phosphorus approximately 500, 80, and 60 mg liters−1 respectively. The synthetic wastewater was composed of (per liter) 250 mg of glucose, 150 mg of yeast extract, 50 mg of MgSO4 · 7H2O, 5 mg of MnSO4 · 7H2O, 2.2 mg of FeSO4 · 7H2O, 7 mg of KCl, 150 mg of NH4Cl, 196.4 mg of KH2PO4, 555.6 mg of NaHCO3, and 3.8 mg of CaCl2. The reactors were seeded with activated-sludge mixed liquor from the NCWRF. The SVI of the inoculum sludge (day −130) was 253 ml g−1.
The experimental run was divided into three stages. In stage I, both reactors were operated as SBRs with alternating anaerobic and aerobic conditions to reduce the sludge SVI. One cycle period was 8 h, which consisted of 2 h of nonaeration, 4 h of aeration, and 2 h of settling and discharge. The hydraulic retention time was 12 h, the mean cell residence time (MCRT) was 16 days, and the dissolved oxygen was controlled to 0.03 mg liter−1 by adjusting the aeration pump setting. In Stage II, the sludges from stage I were combined and equally distributed to the two reactors. One of the two reactors was operated as an SBR (12-min fill time) and the other was operated as a CMR (continuous fill). In the first reactor run, S. natans cells were added to the mixture of the sludge from the two reactors to a final concentration of approximately 0.017 g of cells liter−1 (∼0.5% of the total sludge). In stage III, both reactors were operated as SBRs as in stage I.
RNA extraction.
Cell cultures were grown to mid-log phase, and RNA was extracted from cell pellets of pure cultures and environmental samples by using a modified low-pH, hot-phenol method (27, 29). The quality of extracted RNA was evaluated using poylacrylamide gel electrophoresis and quantified using the Gel-Pro Image Analysis software v. 3.1 (Media Cybernetics, Silver Spring, Md.) using Escherichia coli 16S rRNA standards (Roche Diagnostics, Indianapolis, Ind.).
Oligonucleotide probes and membrane hybridizations.
The oligonucleotide probes used for FISH and membrane hybridizations are listed in Table 1. For FISH, Cy3- or Oregon Green-labeled probes targeting S. natans, L. mucor, and type 1851 were obtained from Sigma-Genosys (The Woodlands, Tex.) and Integrated DNA Technologies, Inc. (Coralville, Iowa). Membrane hybridizations with oligonucleotide probes labeled with [γ-32P]ATP (ICN Biomedicals, Costa Mesa, Calif.) were performed as previously described (10), with minor modifications. PerfectHyb Plus hybridization buffer (Sigma-Aldrich Chemicals, St. Louis, Mo.) was used in hybridizations, and labeled probes were purified using mini-Quick Spin Oligo columns (Roche Diagnostics Corp., Indianapolis, Ind.), as specified by the manufacturer. Results were expressed as the concentration of target rRNA over the total rRNA in the samples (10, 27).
TABLE 1.
Probe names, target groups, and hybridization conditions used in this study
| Probe namea | Target group | Probe use | Tw (°C) | Formamide (%) | Reference |
|---|---|---|---|---|---|
| S-*-Univ 1390-a-A-18 | Almost all organisms | Membrane | 44 | NAb | 31 |
| S-D-Bact-0338-a-A-18 | Domain Bacteria | Membrane | 56 | NA | 2 |
| S-D-Bact-0338-a-S-18 | Antisense Bacteria probe | FISH | NA | 0 | 2 |
| S-S-S.nat-0656-a-A-18 | S. natans | Membrane/FISH | 46 | 45 | 30; this study |
| S-S-L.muc-0652-a-A-18 | L. mucor | Membrane/FISH | 65 | 35 | 30; this study |
| S-*-1851-0592-a-A-21 | Eikelboom type 1851 | FISH | NA | 35 | 3 |
Probe names have been standardized according to the Oligonucleotide Probe Database (1).
NA, not applicable.
Dissociation temperature study.
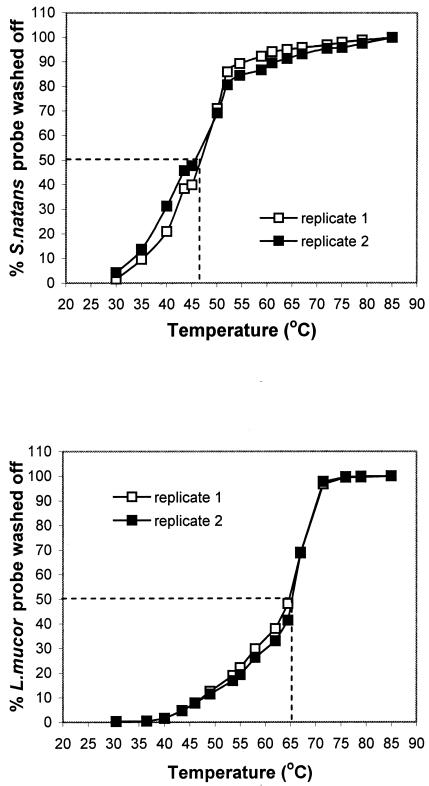
Since the S. natans-specific and L. mucor-specific probes were originally designed for FISH, optimal wash conditions after membrane hybridization were determined by performing dissociation temperature (Td) studies using an elution method (31). The temperature at which 50% of the hybridized probe was washed off was determined to be the Td of the probe.
FISH and filament length quantification.
FISH was performed as previously described (12, 30). Hybridization buffer included 45% formamide for S. natans and 35% formamide for L. mucor and type 1851. FISH images were captured with a Photometrics Sensys charge-coupled device camera mounted on a Nikon Optiphot II fluorescence microscope. Images were analyzed for filament length using Metamorph software (Universal Imaging Corp., Silver Spring, Md.). Positive controls (hybridization to pure cultures) and negative controls to assess nonspecific binding (hybridization to tetramethylrhodamine-5-isothiocyanate [TRITC]-labeled non-Eub probe) were routinely performed. Autofluorescence was routinely assessed by analyzing images obtained with excitation and emission spectra outside the spectral wavelengths of the fluorescent dyes used.
To develop the relationship of filament length (quantified by image analysis after FISH) to biomass, 100-ml batch cultures of S. natans and L. mucor were grown and FISH was conducted on dilutions of pure cultures of S. natans and L. mucor. Total suspended solids and VSS were determined in triplicate for each dilution. Culturing, dilutions, and FISH were performed in duplicate. At each dilution, three wells on the microscope slide were used. Ten random fields were captured from each well. The total filament length from each image field was then determined manually using the Measurements command in MetaMorph, calibrated on micrometers, and the means and average standard deviations were computed. When the length measurement for a field gave a covariance greater than 40%, the filament dispersion was judged to be nonuniform and the result was discarded (19). Filament length per volume (Lv, in micrometer per milliliter) was calculated using the following equation (19): Lv = [(Lf × Aw)/(V × a)] × DF, where Lf is the average total filament length per field (micrometers), Aw is the area of the well (square micrometers); V is the volume of sample applied (milliliters), a is the area of the microscope field (square micrometers), and DF is the dilution factor.
Filament length measurements were performed using six wells and four random pictures per well to increase the power of the test while keeping the sample size reasonable (see Results). Shaking for 1 min (Mini Bead-Beater-8; BioSpec Products, Inc., Bartlesville, Okla.) was performed for stage I samples to ensure probe accessibility because of the granular, compacted nature of the sludge. With stage II laboratory- and full-scale plant samples, two sets of measurements were carried out: (i) the total filament length was determined from the signal of the species-specific probe and (ii) the portion of the filaments that is outside the floc, or the extended filament length, where the floc boundary was defined by 4′,6-diamidino-2-phenylindole (DAPI) staining of the floc structure, was determined. For samples from full-scale activated sludge plants, sonication for 1 min (sonic dismembrator model F550; Fisher Scientific, Pittsburgh, Pa.) was performed to ensure floc breakup in total-filament measurements. For activated-sludge samples, two independent observers performed the measurements and the average of the measurements was obtained.
Statistical analysis.
FISH filament lengths were checked for normality and were log-transformed before analysis. To determine the appropriate number of microscope wells and fields of view within a well, samples from pure-culture cell dilutions and activated-sludge samples were analyzed. The power of the hypothesis test that there is no difference in filament lengths between two samples (i.e., the probability of rejecting the null hypothesis of no difference between two samples if the alternate hypothesis is true) was determined by calculating the F-statistic using SAS software (SAS Institute, Cary, N.C.). The calculation assumed that the smallest difference between mean log counts is 0.3 at a significance level of 0.05. Power as a function of the number of wells and number of fields of view per well was calculated. Pearson correlation analysis was performed for SVI and filament length data at a significance level of 0.05.
RESULTS
Dissociation temperature study.
An accurate determination of the post-hybridization wash temperature is crucial to ensure probe specificity in membrane hybridizations. Optimum wash conditions in membrane hybridizations have not been previously determined for the FISH-designed S. natans-specific and L. mucor-specific probes (30). Figure shows 50% elution of hybridized probes at wash temperatures of 46 and 65°C for the S. natans- and L. mucor-targeted probes. These temperatures were adopted in subsequent hybridizations.
Sampling regimen.
A table of statistical power versus number of wells and fields of view was constructed (Table 2). As expected, the within-well variance was much larger than the across-well variance. Values of power less than 0.5 are not reported, and all values are rounded to the nearest tenth. The table was used to determine the number of wells and number of fields of view per well to give statistically meaningful comparisons. For example, if measurements were obtained from three wells per sample (nw = 3) and 10 random image fields per well (np = 10), the probability that the F test would find a statistically significant difference in mean log count across dilutions is 0.5 if the true difference is 0.3. Since the actual difference between dilution samples is larger, the power is higher for most comparisons. Filament counts for the activated-sludge samples were obtained from six wells and four pictures per well, giving a power of 0.7.
TABLE 2.
Power of the FISH method as a function of sampling regimen
| No. of wells (nw) | Probabilitya for following no. of fields of view per well (np):
|
|||||||||
|---|---|---|---|---|---|---|---|---|---|---|
| 1 | 2 | 3 | 4 | 5 | 6 | 7 | 8 | 9 | 10 | |
| 3 | 0.5 | 0.5 | 0.5 | |||||||
| 4 | 0.5 | 0.5 | 0.5 | 0.6 | 0.6 | 0.6 | 0.6 | |||
| 5 | 0.5 | 0.6 | 0.6 | 0.7 | 0.7 | 0.7 | 0.7 | 0.7 | ||
| 6 | 0.5 | 0.6 | 0.7 | 0.7 | 0.8 | 0.8 | 0.8 | 0.8 | 0.8 | |
| 7 | 0.5 | 0.7 | 0.7 | 0.8 | 0.8 | 0.8 | 0.9 | 0.9 | 0.9 | |
| 8 | 0.6 | 0.8 | 0.8 | 0.8 | 0.9 | 0.9 | 0.9 | 0.9 | 0.9 | |
| 9 | 0.7 | 0.8 | 0.8 | 0.9 | 0.9 | 0.9 | 0.9 | 0.9 | 0.9 | |
| 10 | 0.5 | 0.7 | 0.8 | 0.9 | 0.9 | 0.9 | 0.9 | 1 | 1 | 1 |
| 11 | 0.5 | 0.7 | 0.8 | 0.9 | 0.9 | 0.9 | 1 | 1 | 1 | 1 |
| 12 | 0.5 | 0.8 | 0.9 | 0.9 | 1 | 1 | 1 | 1 | 1 | 1 |
| 13 | 0.6 | 0.8 | 0.9 | 0.9 | 1 | 1 | 1 | 1 | 1 | 1 |
| 14 | 0.6 | 0.8 | 0.9 | 1 | 1 | 1 | 1 | 1 | 1 | 1 |
| 15 | 0.6 | 0.9 | 0.9 | 1 | 1 | 1 | 1 | 1 | 1 | 1 |
| 16 | 0.7 | 0.9 | 1 | 1 | 1 | 1 | 1 | 1 | 1 | 1 |
| 20 | 0.8 | 0.9 | 1 | 1 | 1 | 1 | 1 | 1 | 1 | 1 |
| 25 | 0.9 | 1 | 1 | 1 | 1 | 1 | 1 | 1 | 1 | 1 |
| 30 | 0.9 | 1 | 1 | 1 | 1 | 1 | 1 | 1 | 1 | 1 |
Numbers represent the probability of rejection of the null hypothesis of no difference between two samples if the true difference in the mean log count is 0.3.
Estimation of S. natans and L. mucor biomass.
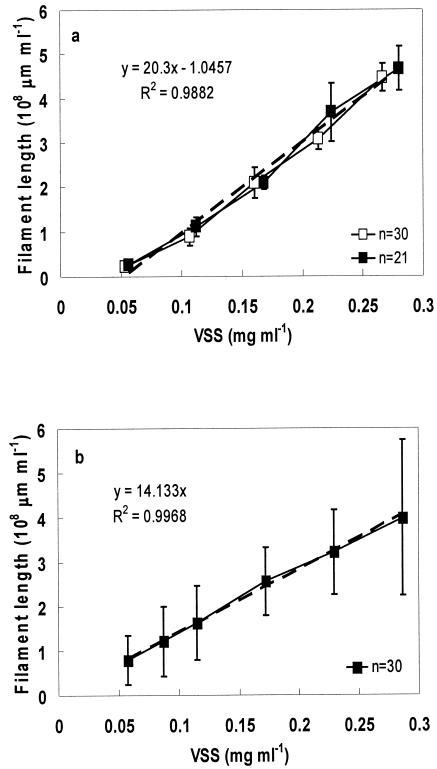
Dilutions of S. natans and L. mucor culture were used to develop the relationship between specific filament length and biomass (measured by VSS). The reference curves are shown in Fig. 2. Two independent cultures of S. natans and L. mucor were grown, and the linear-regression analysis for both cultures resulted in the same respective regression equation, showing the reproducibility of the data. The independent duplicate measurements resulted in R2 values of 0.985 (Fig. 2a) and 0.997 (Fig. 2b) for S. natans and L. mucor, respectively. The regression curve for S. natans did not have an intercept of zero, due to the difficulty of detecting S. natans cells under the level of 0.05 mg of VSS ml of sample−1. Approximately 5% of all sample sets were discarded as nonuniform (covariance, >40%). The fraction of S. natans in environmental samples was estimated using the following equation (19): % (g of S. natans/g of VSS) = {[Rc × (Lv + 0.97 × 10⁸)]/VSS} × 100%, where Rc is the regression constant from Fig. 2a (5.0 × 10⁻¹⁰ mg/μm); Lv is the average length per volume (micrometers per milliliter), and VSS is the volatile suspended solids concentration (milligrams per milliliter).
FIG. 2.
Correlation between filament length determined by FISH and filament biomass. (a) S. natans. (b) L. mucor. Error bars represent standard deviation of filament length means for each well.
The biomass concentration of L. mucor can be determined using a similar equation, with a regression coefficient of 7.0 × 10⁻¹⁰ mg/μm. Based on FISH, the biomass contribution of S. natans in the Greenville plant mixed liquor was 5.13% ± 0.8% of the total VSS, which is slightly lower than the 7.2% ± 1.1% contribution of S. natans to the total rRNA determined by membrane hybridization. Leucothrix was not detected by FISH in the Greenville WWTP sample, and comparison between the two hybridization methods was not possible. To quantify the threshold value of filament length for Sphaerotilus- and Leucothrix-caused bulking, samples from treatment plants with bulking problems caused mainly by Sphaerotilus or Leucothrix were needed. FISH was performed on several paper mill plant and municipal wastewater treatment plant samples, but very few Sphaerotilus and L. mucor cells were detected. Therefore, another experimental approach, enriching augmented S. natans or L. mucor in laboratory-scale reactors, was attempted.
Bulking in laboratory-scale reactors.
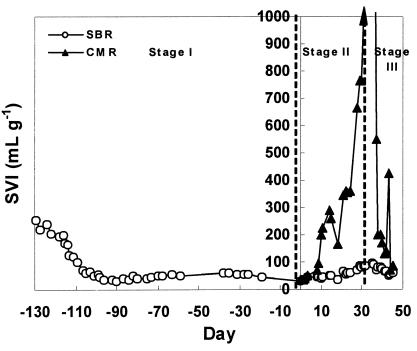
In stage I, the objective was to reduce the SVI to less than 150 ml/g, which is generally regarded as the threshold SVI for bulking (20). The SVI of both reactors decreased from 270 ml g−1 at the beginning of this stage to around 50 ml g−1 (Fig. 3). Microscopic observation (data not shown) showed that most filamentous bacteria were washed out or decayed. One month after start-up, the SVIs of both the reactors decreased to around 40 ml g−1. This stage lasted for more than 4 months (day −130 to day 0). In stage II, S. natans cells were added to the SBR and CMR to stimulate bulking. One week after the change in operational condition, the CMR began bulking and the SVI increased from 92.9 to 198.2 ml g−1 (day 10). In stage III, the CMR was switched to SBR operation as in stage I. The SVI of the CMR decreased sharply and, within one mean cell residence time (MCRT, day 36 to day 45), returned to nonbulking status with a final concentration of 72.5 ml g−1. During the entire run, the SBR sludge remained nonbulking and the SVI remained in the range from 40.3 to 83.8 ml g−1.
FIG. 3.
SVI changes over time in laboratory-scale reactors.
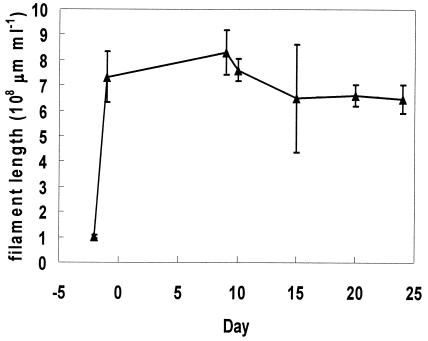
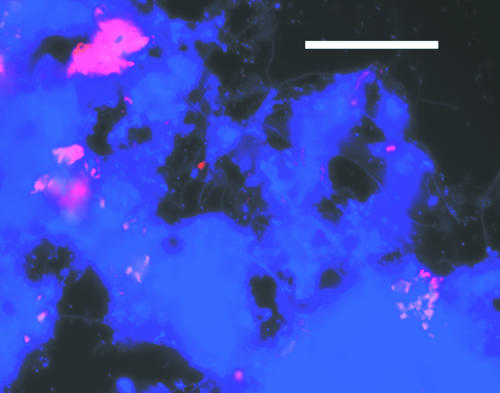
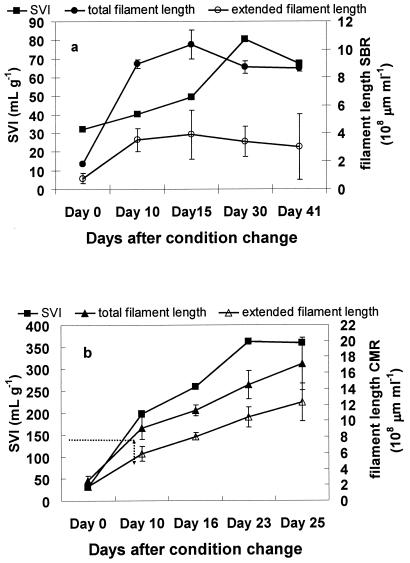
The level of S. natans briefly increased in the CMR after inoculation, from 1.0 × 10⁸ to 7.2 × 108 μm ml−1; it then decreased and stabilized at 6.5 × 108 μm ml−1 (Fig. 4). FISH showed that S. natans remained in the nonfilamentous form (Fig. 5) and was not correlated to SVI (r0.05 = 0.21). Instead of S. natans, another gram-negative filament was found to be dominant during bulking. The identity of the dominant filament was determined by performing FISH using previously published probes (23, 30) for gram-negative filaments and the α, β, and γ subclasses of proteobacteria (working from probes targeting large microbial groups to probes targeting increasingly smaller phylogenetic groups). FISH showed that this filament was Eikelboom type 1851 (Fig. 6). In the SBR, high levels of type 1851 were measured, but there was no correlation (p = 0.05) between type 1851 total and extended filament length and reactor SVI (Fig. 7a). For the CMR, quantitative FISH showed that SVI and extended filament length of type 1851 were strongly correlated (r0.05 = 0.96), which suggests that type 1851 proliferation may be the cause of bulking in the CMR (Fig. 7b).
FIG. 4.
S. natans levels quantified by FISH after inoculation in CMR. Error bars represent standard deviation of filament length means for each well.
FIG. 5.
FISH micrograph showing S. natans cells (red) 1 day after inoculation in CMR. This experiment used probe S- S-S.nat-0656-a-A-18 labeled with Cy3, counterstained with DAPI (blue) staining all cells. Bar, 50 μm.
FIG. 6.
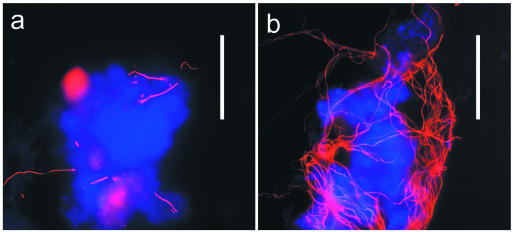
FISH micrographs showing the increase of type 1851 (red) levels over time in CMR. This experiment used probe S-*-1851-0592-a-A-21 labeled with Cy3, counterstained with DAPI (blue). (a) mixed liquor on day 0. (b) Mixed liquor on day 10. Bar, 50 μm.
FIG. 7.
Plots of SVI versus filament length. (a) SBR, (b) CMR. Error bars represent standard deviation of filament length means for each well.
Bulking in a full-scale activated-sludge plant.
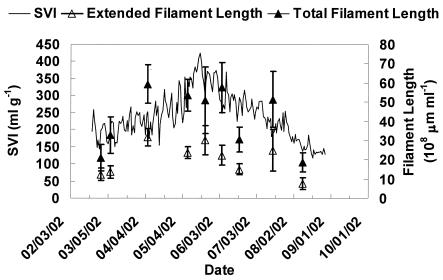
FISH with various oligonucleotide probes showed that type 1851 was the dominant filament in the activated sludge from the NCWRF full-scale plant. Figure 8 shows the SVI and the total and extended filament length of type 1851 at this facility over a period of 6 months. Correlation analysis shows that the SVI of NCWRF is significantly correlated to both the total (r = 0.65) and the extended (r = 0.68) filament length of Eikelboom type 1851 (r0.05 = 0.60). In Fig. 8, an SVI of 150 ml/g corresponds to a type 1851 extended length of ∼1.0 × 109 μm ml−1, which is greater than that determined from the reactor experiment (6 × 108 μm ml−1). However, because the full-scale plant was almost always bulking during the study period, very few SVI values below 150 ml g−1 were included in this analysis. It is likely that the threshold value for the full-scale plant is lower than 1.0 × 109 μm ml−1.
FIG. 8.
Plot of SVI versus filament length at the NCWRF. Error bars represent standard deviation of filament length means for each well.
DISCUSSION
Quantitative FISH.
The use of FISH for generating statistically meaningful quantitative data is beset with challenges. Counts of specific cells labeled by FISH can be normalized to DAPI counts, but this may be difficult in activated-sludge samples. Background fluorescence and autofluorescence are common in environmental samples like activated sludge, and make automated image analysis of digitized micrographs complicated. The adequacy of sampling must be evaluated statistically. These problems are nontrivial and should be directly considered in every application (9). The problem of normalization is diminished for the quantification of filamentous bacteria: the effect of filaments on bulking and foaming are physical (i.e., related to biomass levels per unit volume), and so the results can be expressed per volume of sample (9, 11). In this study, we circumvented problems with DAPI counts by normalizing per volume of sample and we evaluated nonspecific probe binding and autofluorescence by using two negative controls.
An approach to quantifying foam-forming filamentous biomass in situ (11, 19) was adopted in this study for S. natans and L. mucor. The method uses a biomass-to-filament length reference curve derived from pure cultures. The main assumption used in this method is that the ratio of biomass (as measured by VSS) to filament length in pure cultures is the same as in environmental samples. In this study, micrograph measurements showed that there were no significant differences in filament width between pure cultures and environmental samples (data not shown). The results can also be expressed as filament length per unit volume or per unit mass of sludge, avoiding problems with conversion to biomass. However, the biomass conversion approach is useful, since such measurements can be used as inputs for mathematical models (25).
A comparison of manual measurement of filament length and automated measurement (11) with image analysis software showed that manual measurement was more precise and accurate (data not shown). Because the filaments exist partially inside and partially outside the floc, the autothresholding function of the image analysis software could not distinguish within-floc filaments from background in all cases. Autothresholding resulted in systematic under- or overcounting compared to manual measurements and as determined by visual inspection of thresholded images (data not shown). Therefore, manual measurements were deemed more accurate. For all counts, at least two people independently measured the filament lengths. The covariance between these measurements ranged from 0.8 to 10.7%, with an average of 3.7%, which was deemed acceptable. The number of wells and image fields needed to give a statistically valid measurement was determined; and the results showed that 24 image fields could be analyzed to give a power of 0.7. While this may seem low, the failure to reject the null hypothesis is not the same as a failure to indicate any difference. If the probability (that the sample means will be substantially different) to reject the null hypothesis is 0.7, then the probability is very high that there will be a noticeable difference between the means.
The regression coefficient determined for L. mucor (7 × 10⁻¹⁰ mg/μm) is slightly larger than that for S. natans (5 × 10⁻¹⁰ mg/μm), but both are of the same order of magnitude as the regression coefficient for Gordonia amarae (4.14 × 10⁻¹⁰ mg/μm) determined previously (11). Since L. mucor cells are normally 2 to 4 μm in diameter while S. natans and G. amarae cells have 1.5- and 1-μm diameters, respectively, the different species should have comparable densities. The FISH method measured the S. natans biomass in the Greenville plant at 5.13% ± 0.8% of the total VSS, which was close to the contribution of S. natans to the total rRNA (7.2% ± 1.1%). Although the results of the two assays are close, it should be noted that the two methods measure different parameters. Hybridization to extracted rRNA measures the combined effects of cell abundance and cell activity (25). It may be hypothesized that S. natans has an equal or slightly higher contribution to the total growth activity compared to its contribution to the total biomass. Because bulking is more closely related to cell biomass than to cell rRNA contribution, FISH appears to be a better method to study bulking. However, combining the two hybridization formats to benefit from the relative advantages of each method is a better approach than FISH or membrane hybridization alone.
Filament lengths and bulking.
Although the laboratory-scale reactors were bioaugmented and operated to induce bulking with these filaments, the bioaugmented cells did not grow in filamentous form (Fig. 6), although large cell numbers were achieved. Various methods that were attempted to culture the S. natans and L. mucor cells in filamentous form did not succeed; the cells grew mostly as rods, and bulking in the reactors due to these cells was not observed. The reactor runs were repeated twice, with no bioaugmentation. In these repeat experiments, type 1851 filaments again dominated and increasing filament lengths were associated with increasing SVI (data not shown). These repeat runs showed that the effect was reproducible and that bioaugmentation with S. natans had no effect on type 1851 growth.
If we equate an SVI of 150 ml g−1 as the point where bulking begins (20), the species-specific bulking threshold for type 1851 can be estimated to be 6 × 108 μm of extended filament length ml−1. Previous studies have shown that in general, the SVI increases rapidly above 100 ml g−1 when total (nonspecific) extended filament lengths increased above 107 μm ml−1 (20). The specific threshold value we determined for type 1851 is an order of magnitude greater than this value, which suggests that different filaments contribute differently to bulking. The numbers may be different because earlier studies did not use calibrated image analysis software but instead used visual estimates of filament length.
It is interesting that both reactors had greater total filament lengths of type 1851 (around 109 μm ml−1 or greater). The difference in the two reactors was in the levels of extended filament length. During the period when the nonbulking SBR had the greatest total filament length, the ratio of the extended filament length (measured as filament outside flocs) to the total filament length (filaments inside and outside flocs) was around 0.4. In the bulking CMR, the filaments were mostly outside the floc and the ratio of extended to total filament length was around 0.7. These results agree with the mechanism for filamentous bulking: extended filaments push flocs apart and prevent good settling (28). Hence, it was possible in this study to have large numbers of filamentous bacteria in sludge and still obtain well-settling sludge, as long as the filaments were inside the floc structure.
Selection for filaments.
The marked difference in SVIs between the SBR and CMR is seemingly in accordance with the prevailing views on selection of filaments, which is traditionally explained on the basis of kinetic differences (7, 20). High-μmax floc formers outcompete low-μmax filaments under high-substrate conditions, while low-Ks filaments outcompete the floc formers under low-substrate conditions. The kinetic selection theory, while popular, is incomplete in explaining the competition between floc formers and filaments, since complete washout of one type never occurs in activated sludge. Various modifications to the theory have been proposed, including the role of incorporated filaments into floc (6), differences in substrate storage kinetics (20; I. Lou and F. L. de los Reyes, Abstr. WEFTEC 2002, paper 1.4, 2002), and differences in decay rates (Lou and de los Reyes, Abstr. WEFTEC 2002). Recently, Martins et al. (24) showed that substrate uptake and potential for substrate storage were similar for floc formers and filaments in laboratory-scale reactors under a given set of conditions. They formulated an alternative hypothesis wherein filaments gain a competitive advantage because of substrate gradients created by diffusion limitation inside the floc. At low substrate concentrations, filaments gain an advantage by extending outside the floc to gain access to the substrate. Conversely, at high substrate concentrations, the filaments can remain inside the floc without suffering a disadvantage because the substrate is not limited inside the floc. Our data appear to support this “diffusion limitation” hypothesis and directly contradict the kinetic selection theory prediction that there should be no filamentous growth under high substrate concentrations. Even under high substrate conditions in the SBR, high levels of filaments were observed in our experiments, albeit inside the flocs. Additional research is needed to determine whether there are no intrinsic differences in the Ks of floc formers and filaments. Regardless of the mechanism for development of filamentous structures, it appears that low substrate concentrations favor the growth of type 1851 under the conditions used in this study.
Type 1851 belongs to the chloroflexi group, is associated with high MCRTs (>10 days) and low food-to-microorganism ratios (<0.2 as kilograms of 5-day biochemical oxygen demand/kilogram of mixed-liquor VSS), and is often seen when simple sugars are present in the wastewater (20). These conditions were present in the laboratory-scale reactors. Filamentous chloroflexi (green non-sulfur bacteria) are abundant in biological nutrient removal WWTPs (4). The full-scale facility used in the present study is a biological nutrient removal plant, as are many WWTPs in North Carolina. It is likely that type 1851 bulking is not confined to this one plant. In a U.S. survey, type 1851 was the 13th most common filament found in WWTPs (20). Since more and more WWTPs are required to upgrade to perform biological nutrient removal, the extent of type 1851-caused bulking may increase.
In the first reactor run, we observed type 1851 as the dominant filament during the onset of bulking. After day 25, FISH showed that Thiothrix spp. codominated in the CMR with type 1851. Only qualitative observations of this phenomenon were performed. Recent research concluded that if another filament began to proliferate, it would cause the regression of the one which was formerly dominant (17). Our observation in the CMR differed from this conclusion, since it appears that two filaments can codominate in a given sludge. Future studies aimed at investigating this succession are needed.
This study related the measurable filament length to the species-specific biomass of S. natans and L. mucor and revealed the role of type 1851 in filamentous bulking. Such species-specific biomass measurements may be useful in the calibration and validation of mathematical models of filament-floc former competition. Bulking was quantitatively shown to be related to the length of extended filaments, and it was shown that a threshold value of 6 × 108 μm ml−1 exists for type 1851 bulking under the conditions used in this study. Evidence for the “substrate diffusion limitation” hypothesis, contrary to the prediction of the kinetic selection theory, was presented. We demonstrated that the quantitative FISH approach is a useful tool in understanding species-specific filamentous bulking. In particular, the method should serve as a guide for evaluating the effectiveness of bulking control measures against specific filamentous species and the delineation of operational conditions conducive to growth. Once these conditions are known for specific problem-causing filaments, wastewater treatment plants can take proactive measures based on fundamental knowledge and not simply react to plant upsets with trial-and-error measures.
FIG. 1.
Results of Td tests. (Top) Optimum wash temperature for probe S-S-S.nat-0656-a-A-18. (Bottom) Optimum wash temperature for S-S-L.muc-0652-a-A-18.
Acknowledgments
We thank Joe Boyer and Bingyan Wu for assistance with statistical analysis and Jon Williams for critical reading of the manuscript and assistance with image acquisition. The support of Chris Parisher and the North Cary Water Reclamation Facility is gratefully acknowledged.
This research was supported by the U.S. National Science Foundation (grant BES 0092851).
REFERENCES
- 1.Alm, E., D. Oerther, N. Larsen, D. Stahl, and L. Raskin. 1996. The Oligonucleotide Probe Database. Appl. Environ. Microbiol. 62:3557-3559. [DOI] [PMC free article] [PubMed] [Google Scholar]
- 2.Amann, R. I., B. J. Binder, R. J. Olson, S. W. Chisholm, R. Devereux, and D. A. Stahl. 1990. Combination of 16S rRNA-targeted oligonucleotide probes with flow cytometry for analyzing mixed microbial populations. Appl. Environ. Microbiol. 56:1919-1925. [DOI] [PMC free article] [PubMed] [Google Scholar]
- 3.Beer, M., E. M. Seviour, Y. Kong, M. Cunningham, L. L. Blackall, and R. J. Seviour. 2002. Phylogeny of the filamentous bacterium Eikelboom Type 1851, and design and application of a 16S rRNA targeted oligonucleotide probe for its fluorescence in situ identification in activated sludge. FEMS Microbiol. Lett. 207:179-183. [DOI] [PubMed] [Google Scholar]
- 4.Bjornsson, L., P. Hugenholtz, G. W. Tyson, and L. L. Blackall. 2002. Filamentous chloroflexi (green non-sulfur bacteria) are abundant in wastewater treatment processes with biological nutrient removal. Microbiology 148:2309-2318. [DOI] [PubMed] [Google Scholar]
- 5.Blackall, L. L. 1999. Bulking, p. 147-160. In R. J. Seviour and L. L. Blackall (ed.), The microbiology of activated sludge. Kluwer Academic Publishers, Dordrecht, The Netherlands.
- 6.Cenens, C., I. Y. Smets, V. G. Ryckaert, and J. F. V. Impe. 2000. Modeling the competition between floc-forming and filamentous bacteria in activated sludge waste water treatment systems. I. Evaluation of mathematical models based on kinetic selection theory. Water Res. 34:2525-2534. [Google Scholar]
- 7.Chudoba, J., J. S. Cech, J. Farkac, and P. Grau. 1985. Control of activated sludge filamenous bulking: experimental verification of a kinetic selection theory. Water Res. 19:191-196. [Google Scholar]
- 8.da Motta, M., M. N. Pons, and N. Roche. 2001. Automated monitoring of activated sludge in a pilot plant using image analysis. Water Sci. Technol. 43:91-96. [PubMed] [Google Scholar]
- 9.Davenport, R. J., T. P. Curtis, M. Goodfellow, F. M. Stainsby, and M. Bingley. 2000. Quantitative use of fluorescent in situ hybridization to examine relationships between mycolic acid-containing actinomycetes and foaming in activated sludge plants. Appl. Environ. Microbiol. 66:1158-1166. [DOI] [PMC free article] [PubMed] [Google Scholar]
- 10.de los Reyes, F., W. Ritter, and L. Raskin. 1997. Group-specific small-subunit rRNA hybridization probes to characterize filamentous foaming in activated sludge systems. Appl. Environ. Microbiol. 63:1107-1117. [DOI] [PMC free article] [PubMed] [Google Scholar]
- 11.de los Reyes, F. L., D. B. Oerther, M. F. de los Reyes, M. Hernandez, and L. Raskin. 1998. Characterization of filamentous foaming in activated sludge systems using oligonucleotide hybridization probes and antibody probes. Water Sci. Technol. 37:485-493. [Google Scholar]
- 12.de los Reyes, F. L., and L. Raskin. 2002. The role of filaments in activated sludge foaming relationship of mycolata levels to foaming initiation and stability. Water Res. 36:445-459. [DOI] [PubMed] [Google Scholar]
- 13.Eikelboom, D. H. 1977. Identification of filamentous organisms in bulking activated sludge. Prog. Water Technol. 8:153-161. [Google Scholar]
- 14.Eikelboom, D. H. 1982. Microscopic sludge investigation in relation to treatment plant operation, p. 47-74. In B. Chambers and E. J. Tomlinson (ed.), Bulking of activated sludge: preventative and remedial methods. Ellis Horwood Ltd., Chichester, United Kingdom.
- 15.Erhart, R., D. Bradford, R. J. Seviour, R. Amann, and L. L. Blackall. 1997. Development and use of fluorescent in situ hybridization probes for the detection and identification of Microthrix parvicella in activated sludge. Syst. Appl. Microbiol. 20:310-318. [Google Scholar]
- 16.Finstein, M. S., and H. Heukelekian. 1967. Gross dimensions of activated sludge flocs with reference to bulking. J. Water Poll. Control Fed. 39:33-40. [Google Scholar]
- 17.Gaval, G., P. Duchene, and J. J. Pernelle. 2002. Filamentous bacterial population dominance in activated sludges subject to stresses. Water Sci. Technol. 46:49-53. [PubMed] [Google Scholar]
- 18.Greenberg, A. E., L. S. Clesceri, and A. D. Eaton. 1998. Standard methods for the examination of water and wastewater. American Public Health Association, American Water Works Association, Water Environment Federation, Washington, D.C.
- 19.Hernandez, M., D. Jenkins, and B. Beaman. 1994. Mass and viability estimations of Nocardia in activated sludge and anaerobic digesters using conventional stains and immunofluorescent methods. Water Sci. Technol. 29:249-259. [Google Scholar]
- 20.Jenkins, D., M. Richard, and G. T. Daigger. 1993. Manual on the causes and control of activated sludge bulking and foaming. Lewis Publishers, Inc., Chelsea, Mich.
- 21.Kohno, T., K. Sei, and K. Mori. 2002. Characterization of type 1851 organism isolated from activated sludge samples. Water Sci. Technol. 46:111-114. [PubMed] [Google Scholar]
- 22.Liu, J. R., and R. J. Seviour. 2001. Design and application of oligonucleotide probes for fluorescent in situ identification of the filamentous bacterial morphotype Nostocoida limicola in activated sludge. Environ. Microbiol. 3:551-560. [DOI] [PubMed] [Google Scholar]
- 23.Manz, W., R. Amann, W. Ludwig, M. Wagner, and K. H. Schleifer. 1992. Phylogenetic oligodeoxynucleotide probes for the major subclasses of proteobacteria: problems and solutions. Syst. Appl. Microbiol. 15:593-600. [Google Scholar]
- 24.Martins, A. M. P., J. J. Heijnen, and M. C. M. van Loosdrecht. 2003. Effect of feeding pattern and storage on the sludge settleability under aerobic conditions. Water Res. 37:2555-2570. [DOI] [PubMed] [Google Scholar]
- 25.Oerther, D. B., F. L. de los Reyes, and L. Raskin. 1999. Interfacing phylogenetic oligonucleotide probe hybridizations with representations of microbial populations and specific growth rates in mathematical models of activated sludge processes. Water Sci. Technol. 39:11-20. [Google Scholar]
- 26.Palm, J. C., D. Jenkins, and D. S. Parker. 1980. Relationship between organic loading, dissolved oxygen concentration and sludge settleability in the completely mixed activated sludge process. J. Water Pollut. Control Fed. 52:2484-2506. [Google Scholar]
- 27.Raskin, L., J. M. Stromley, B. E. Rittmann, and D. A. Stahl. 1994. Group-specific 16S rRNA hybridization probes to describe natural communities of methanogens. Appl. Environ. Microbiol. 60:1232-1240. [DOI] [PMC free article] [PubMed] [Google Scholar]
- 28.Sezgin, M., D. Jenkins, and D. Parker. 1978. A unified theory of filamentous activated sludge bulking. J. Water Pollut. Control Fed. 50:362-381. [Google Scholar]
- 29.Stahl, D. A., B. Flesher, H. R. Mansfield, and L. Montgomery. 1988. Use of phylogenetically based hybridization probes for studies of ruminal microbial ecology. Appl. Environ. Microbiol. 54:1079-1084. [DOI] [PMC free article] [PubMed] [Google Scholar]
- 30.Wagner, M., R. Amann, P. Kampfer, B. Assmus, A. Hartmann, P. Hutzler, N. Springer and K. Schleifer. 1994. Identification and in-situ detection of Gram-negative filamentous bacteria in activated sludge. Syst. Appl. Microbiol. 17:405-417. [Google Scholar]
- 31.Zheng, D., E. Alm, D. A. Stahl, and L. Raskin. 1996. Characterization of universal small-subunit rRNA hybridization probes for quantitative molecular microbial ecology studies. Appl. Environ. Microbiol. 62:4504-4513. [DOI] [PMC free article] [PubMed] [Google Scholar]


