
Figure.
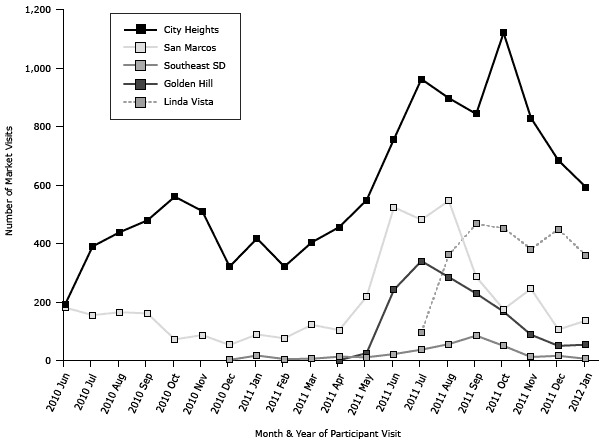
Number of Fresh Fund market visits by market location and month (20,089 total visits), June 1, 2010, through January 31, 2012. The Southeast San Diego Market opened in December 2010, the Golden Hill Market opened in April 2011, and the Linda Vista Market opened in July 2011. A media marketing campaign was initiated in June 2011.
| Month and Year | City Heights | San Marcos | Southeast SD | Golden Hill | Linda Vista | Total |
|---|---|---|---|---|---|---|
| 2010 Jun | 192 | 181 | — | — | — | 373 |
| 2010 Jul | 390 | 155 | — | — | — | 545 |
| 2010 Aug | 439 | 165 | — | — | — | 604 |
| 2010 Sep | 479 | 161 | — | — | — | 640 |
| 2010 Oct | 560 | 72 | — | — | — | 632 |
| 2010 Nov | 511 | 87 | — | — | — | 598 |
| 2010 Dec | 321 | 53 | 2 | — | — | 376 |
| 2011 Jan | 417 | 89 | 17 | — | — | 523 |
| 2011 Feb | 321 | 76 | 5 | — | — | 402 |
| 2011 Mar | 404 | 122 | 6 | — | — | 532 |
| 2011 Apr | 456 | 104 | 13 | 1 | — | 574 |
| 2011 May | 548 | 218 | 11 | 25 | — | 802 |
| 2011 Jun | 757 | 524 | 22 | 242 | — | 1,545 |
| 2011 Jul | 962 | 481 | 37 | 340 | 95 | 1,915 |
| 2011 Aug | 897 | 546 | 56 | 285 | 361 | 2,145 |
| 2011 Sep | 843 | 286 | 85 | 229 | 467 | 1,910 |
| 2011 Oct | 1,120 | 175 | 50 | 167 | 452 | 1,964 |
| 2011 Nov | 829 | 245 | 12 | 88 | 381 | 1,555 |
| 2011 Dec | 684 | 106 | 16 | 50 | 449 | 1,305 |
| 2012 Jan | 593 | 136 | 6 | 54 | 360 | 1,149 |
Abbreviation: —, market not open.