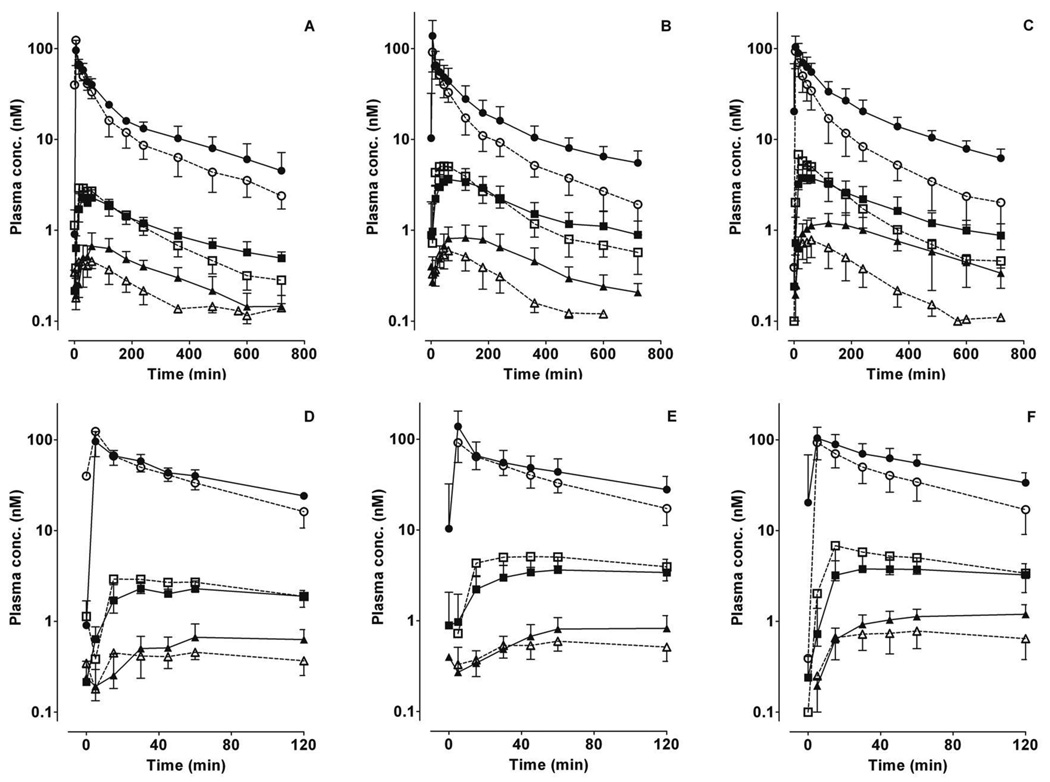
Figure 1. Plasma concentration-time profiles for midazolam and primary metabolites following intravenous administration of midazolam.
The mean ± S.D. data points for midazolam (circles), 1’-hydroxymidazolam (squares) and 4-hydroxymidazolam (triangles) in the absence (open symbols) or presence (solid symbols) of fluconazole for the three CYP3A5 genotype groups (A, D: CYP3A5*1/*1; B, E: CYP3A5*1/*X; C, F: CYP3A5*X/*X) are shown. Fluconazole (400 mg) was administered orally 120 min before midazolam. Panels D, E, F depict the same data from time 0 to 120 min.

