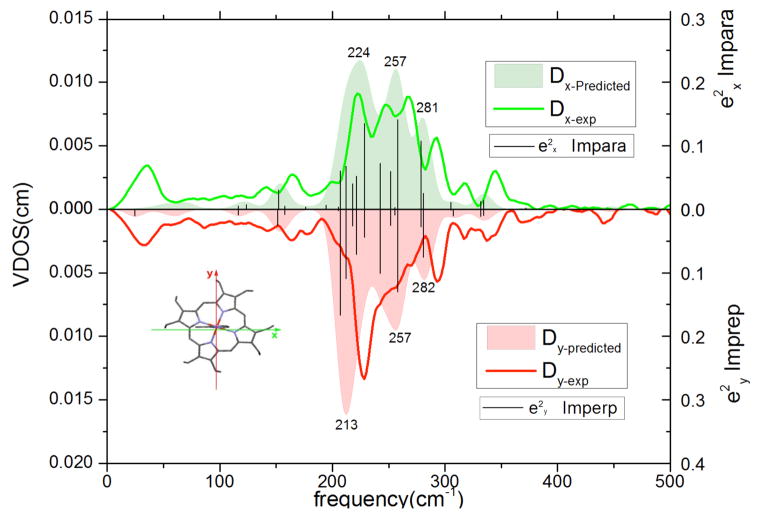
Figure 2.
Directional contributions to the VDOS of [Fe(OEP)(2-MeHIm)] for the x and y directions. For x (top panel), the exciting beam is parallel to the porphyrin plane and the imidazole plane, for y (bottom panel), the beam is parallel to the porphyrin plane and perpendicular to the imidazole plane. In each panel, the solid bars represent the DFT-predicted values; the solid line is the experimentally observed spectrum and the filled spectrum is the predicted spectrum based on the sum of 15 cm−1 (FWHH) Gaussians with areas determined by the e2 values. The numbers on the filled (predicted) spectra are the values of the apparent peak maxima.

