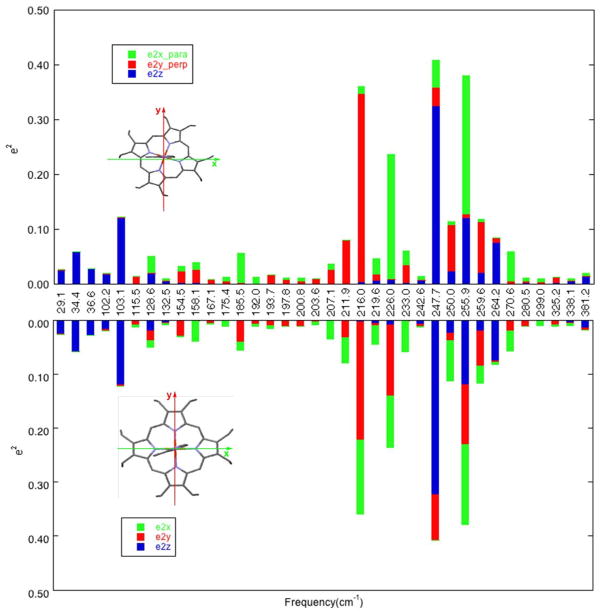
Figure 7.
Bar graph showing DFT-predicted directional characteristics of all 36 modes of the imidazolate complex [Fe(OEP)(2-MeIm−)]− with e2Fe > 0.01 for two different definitions of the orthogonal coordinate system. In the top panel x is defined as parallel to the imidazolate plane and y is defined as perpendicular to the imidazolate plane, whereas in the bottom panel x and y are defined along the Fe–Np bond directions. (Coordinate directions also shown in the porphyrin outlines.) Color code: , green; , red; , blue.

