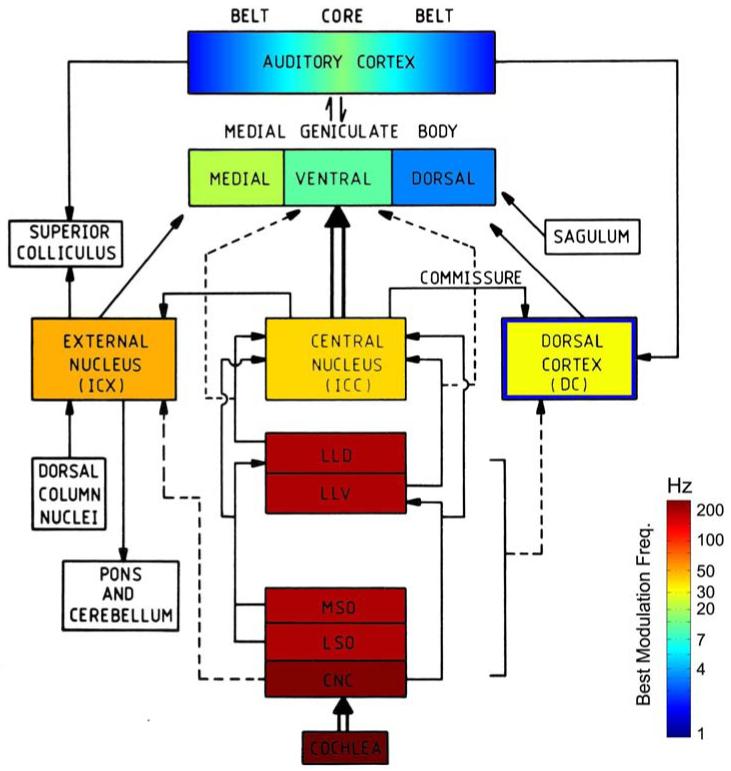
Figure 15.
Illustration of basic auditory CNS connections and typical BMFs (based on studies in various mammals, and likely applicable overall to humans). The basic diagram is adapted from Aitkin (1986), and the data for the BMFs is based primarily on Joris et al. (2004) for ‘core’ regions. The colors have been selected according to the overall central tendency and are for illustrative purposes only. For full quantitative results, consult Joris et al. (2004) and the references therein. The main purpose for the figure is to illustrate our own hypothesis (prediction) about BMFs in the ‘belt’ regions. There is little existing data for IC ‘belt’ regions (ICX, ICD), or for belt regions of thalamus (MGBm, MGBd). But, as argued in the text, ICD may give the slowest AM tunings of any IC subdivision, including a significant fraction of cells with low-pass or 1-2 Hz tuning (indicated by the blue rim). We also depict for thalamic BMFs that overall MGBm > MGBv > MGBd. The diagram shows our hypothesis that fluctuation range (~1-10 Hz) tuning arises primarily in ‘belt’ regions of cortex, although ICD and MGBd may be involved. In any case, the observed BMFs in the majority of the IC, and in lower parts of the auditory pathway, are entirely too fast (roughness or periodicity pitch ranges).

