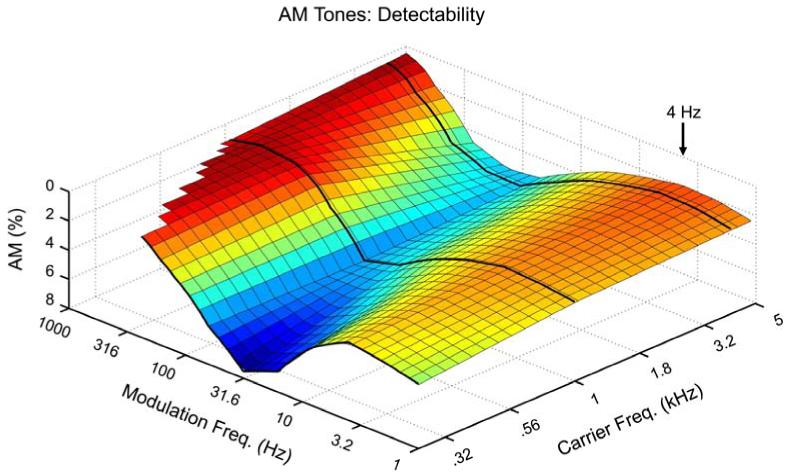
Figure 3.
Detectability of AM tones as a function of fc and fm according to data of Zwicker (1952), which is the most complete to date. Three fcs were tested (0.25, 1 and 4 kHz), as indicated by the black curves, over a wide range of fms. Further details are given in the text. The major result for present purposes is the peak in sensitivity centered at fm = 4 Hz. Note also the overall increase in sensitivity in going to toward the basal region of the cochlea (higher fcs), which play an overall stronger role in temporal envelope processing.

