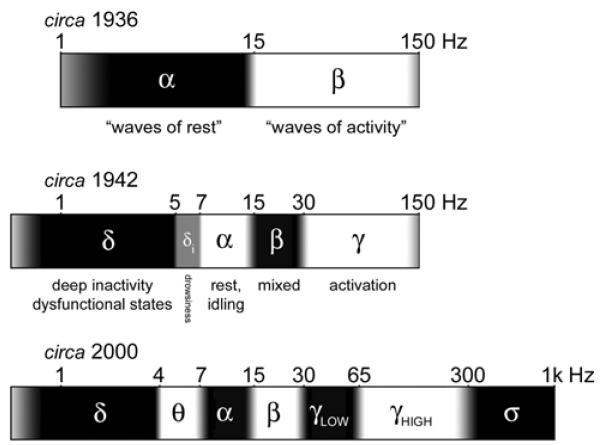
Figure 9.
History of the EEG spectrum. All boundaries are approximate (indicated by gray transitional areas), due to different usages by different authors, but best-fit integers for the boundaries are indicated. The frequency scale is logarithmic. Top (circa 1936): Two frequency bands, α and β, were distinguished by Berger (1930), with the division at ~15-20 Hz. The lower/upper boundaries of α/β were not specified (frequencies outside the range ~2-150 Hz were not studied then). Ectors (1936), who systematically mapped sensory and motor cortices in awake rabbits, aptly referred to these ranges as “waves of rest” and “waves of activity”. Middle (circa 1942): δ (~0.5-5 Hz) was introduced by Walter (1936) for slow rhythms from dysfunctional tissue in the vicinity of tumors, and was quickly adopted for slow waves during deep sleep (Davis et al., 1937). γ (above ~30 Hz) was introduced by Jasper and Andrews (1938), although it had been discovered and systematically used for brain activation mapping by Ectors (1936). The “intermediate δ” band (~5-7 Hz) was introduced by Jung (1941) as a sign of drowsiness, and is included here as the precursor to today’s θ band (~4-7 Hz), also well-known to correlate with drowsiness. Bottom (circa 2000): The contemporary EEG spectrum includes the θ band (Walter and Dovey, 1944) and division of the γ band into low (~30-60 Hz) and high (~65-300 Hz) regions (Crone et al., 1998). A set of phenomena above ~300 Hz are generated by summed multi-unit spiking, labeled here the σ band (after Curio, 2000). Note that the recent labels (high-γ, σ) are not universally accepted, and note that high/low divisions have been proposed for other bands also.

