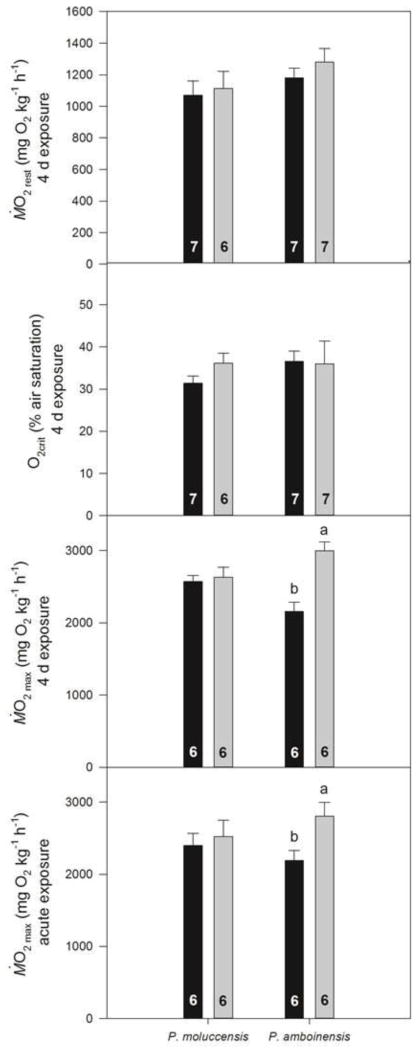
Fig. 1.
Respiratory performance (mean ±SE) of P. moluccensis and P. amboinensis. A. Resting oxygen consumption rate (Ṁ O2rest; mgO2 kg−1 h−1), B. Critical oxygen concentration (O2crit; % of air saturation), C. Maximum oxygen consumption rate (Ṁ O2max; mgO2 kg−1 h−1) after a 4 d exposure to control seawater (451 μatm;■) or near-future CO2 seawater (860 μatm;■) and D. Ṁ O2max after an acute exposure to near-future CO2 seawater. Letters that differ indicate statistically significant differences (see text for p values). N numbers are indicated at the bottom of each bar.

