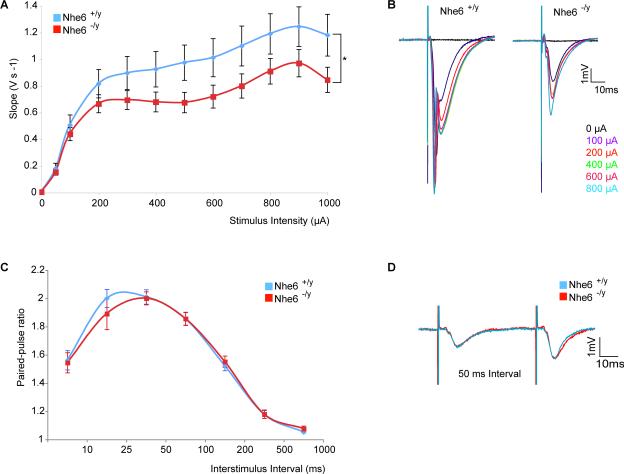
Figure 5. NHE6 deficient mice have reduced synaptic field potentials for a given stimulus.
(A) Extracellular synaptic field potentials in acute hippocampal slices are diminished in the mutants (Nhe6 −/y) compared to wild type (Nhe6 +/y) littermates. Curves are shown as the mean ± SEM of the initial negative slope of the fEPSP as a function of increasing stimulation current (Nhe6 +/y, n=12 animals; Nhe6 −/y, n = 18 animals; p<0.0001. P value was obtained using a two way ANOVA non-matched analysis for the difference between the curves corresponding to each genotype). (B) Representative traces at increasing stimulation of slices from mutant (Nhe6 −/y) and control (Nhe6 +/y) males are shown at 0μA (black), 100μA (purple), 200μA (red). (C) Paired-pulse facilitation (PPF) in mutant and wild-type male littermates suggests no defects in presynaptic release probability. The average ratios of the initial negative fEPSP slopes after two synaptic stimuli elicited at different time intervals for Nhe6 −/y (n=9), ie PPF, is indistinguishable from Nhe6 +/y (n=17). Ratios are shown as mean ± SEM. (D) Superimposed representative traces of PPF responses at 50ms interval is shown for the control (blue) and mutant (red) paired littermates. Scale bar: 1mV, 10ms. See also Supplementary Figure 8.

