
TABLE 3.
Increase or decrease in PSA and PV within each group after 1 year
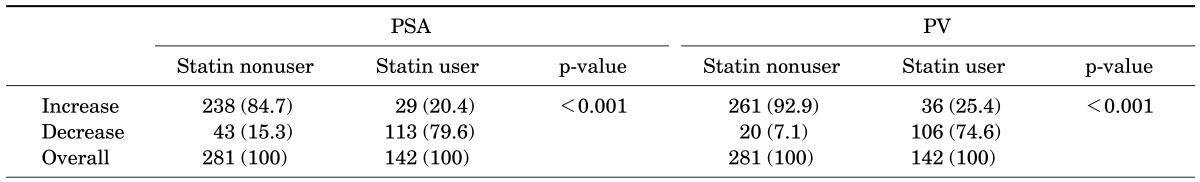
Values are presented as number (%). A p-value is for chi-square test.
PSA, prostate-specific antigen; PV, prostate volume.
Official websites use .gov
A
.gov website belongs to an official
government organization in the United States.
Secure .gov websites use HTTPS
A lock (
) or https:// means you've safely
connected to the .gov website. Share sensitive
information only on official, secure websites.
Increase or decrease in PSA and PV within each group after 1 year
Values are presented as number (%). A p-value is for chi-square test.
PSA, prostate-specific antigen; PV, prostate volume.