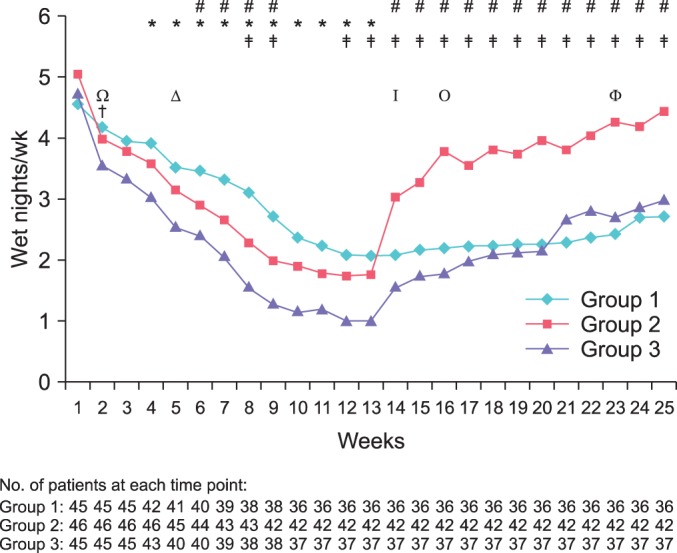
FIG. 3.

Wetting frequencies were analyzed week by week in the 3 groups by using paired and independent t-tests. Baseline (week 1); treatment period (weeks 2-13); follow-up period (weeks 14-25). (Δ), time of significant reduction of wet nights in group 1 (p=0.0001); (Ω), time of significant reduction in wet nights in group 2 (p=0.0001); (†), time of significant reduction of wet nights in group 3 (p<0.0001); (Φ), time of significant rebound in group 1 (p=0.0074); (I), time of significant rebound in group 2 (p=0.0009); (O), time of significant rebound in group 3 (p=0.0047); (*), p<0.05, intergroup comparison of group 1 vs. 2; (‡), p<0.05, intergroup comparison of group 1 vs. 3; (#), p <0.05, intergroup comparison of group 2 vs. 3.
