
TABLE 2.
Mean number and percentage reduction of wet nights at the end of treatment and end of follow-up
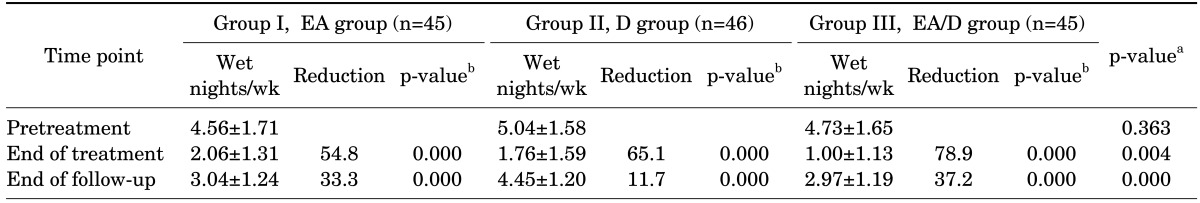
Values are presented as mean±standard deviation or percentage. Wetting frequencies at different time points were compared with pretreatment values within group by using paired t-tests. Wetting frequencies at different time points were compared between groups by using analysis of variance (ANOVA).
EA, enuresis alarm alone; D, desmopressin alone; EA/D, combination of enuresis alarm and desmopressin.
a:ANOVA test. b:Paired t-test.