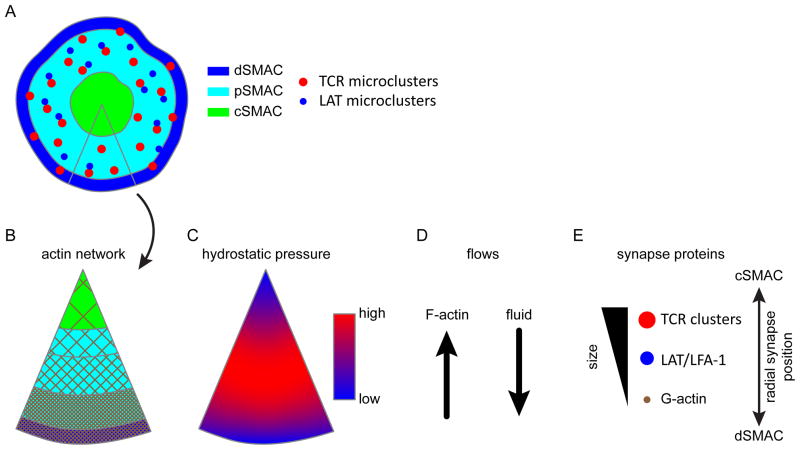
Fig. 2. Models of cellular transport.
(A) The organization of the immune synapse macromolecular domains. Microclusters are generated in the periphery in the pSMAC and dSMAC, and then flow into the cSMAC. (B) A slice through the immune synapse domains showing the branched actin network. F-actin density is highest in the peripheral SMAC zones. As a result, the cytosolic pore size is inversely proportional to the distance from the center of the synapse. Due to the small pore size in the pSMAC, signaling complexes are efficiently coupled to retrograde actin flow. (C) A proposed, simplified map of hydrostatic pressure across the synapse. (D) As signaling complexes centralize, they are simultaneously subjected to retrograde actin flow toward the cSMAC and anterograde fluid flow through the poroelastic media toward the periphery of the cell. (E) The two forces counteract each other, modulating the flow of solid material through the cell in a size-dependent manner. The balance of these two forces regulates the speed and direction of protein complex movement. Large complexes, such as TCRs microclusters, segregate into the interior region with a larger cytosolic pore size. Intermediate size complexes, such as LAT and integrin microclusters, are coupled to actin retrograde flow in the pSMAC but are unstable in the cSMAC. Very small particles, such as actin monomers, are driven by hydrostatic pressure to the edge of the synapse as in migrating cells, allowing continuous actin treadmilling.

