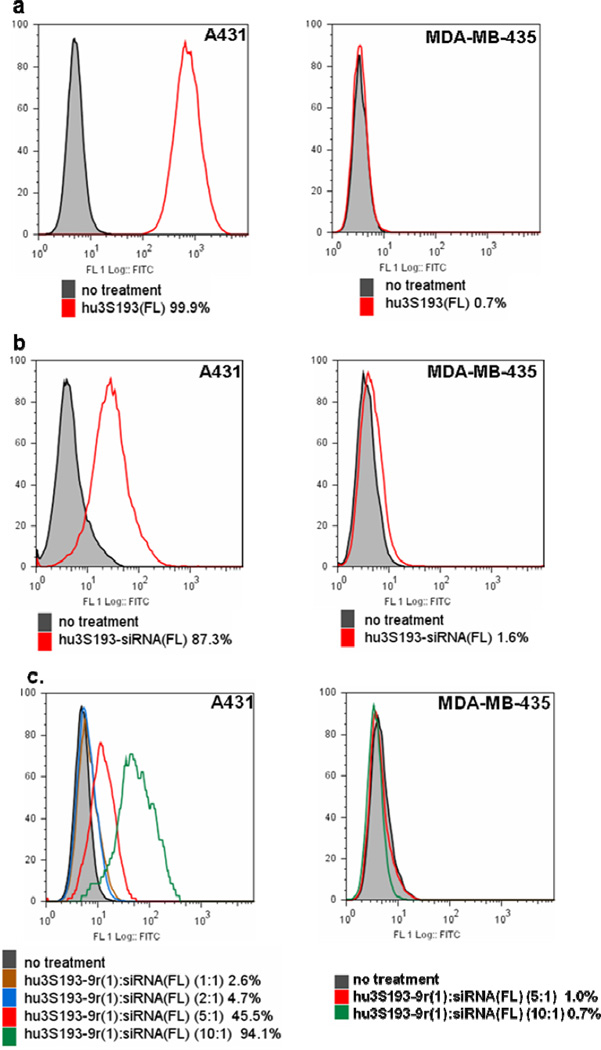
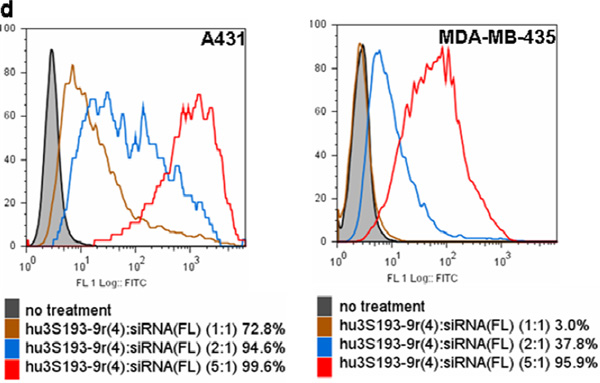
Figure 3. Flow cytometry analysis of cell binding.
a) Ley expression in A431 and MDA-MB-435. The cells were stained with hu3S193(FL); b) Cell binding of hu3S193-siRNA(FL); c) Cell binding of hu3S193-9r(1):siRNA(FL) and d) hu3S193-9r(4):siRNA(FL). The constructs hu3S193-9r(1) or hu3S193-9r(4) were incubated with siRNA(FL) at various molar ratios. The mixtures were then used to stain the cells. The siRNA concentration was 300 nM for all binding studies. The percentage of fluorescein positive cells is indicated for each treatment.


