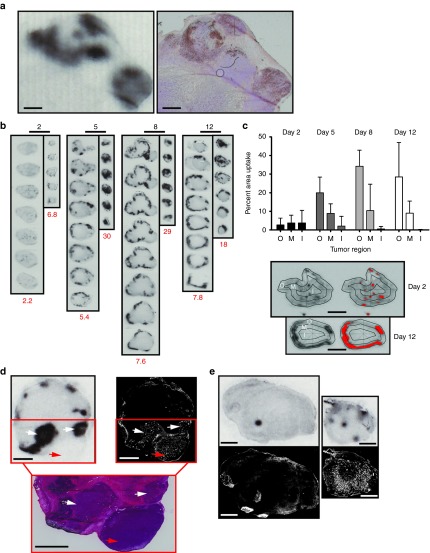
Figure 4.
High-resolution ex vivo imaging correlates virus replication with tumor perfusion over time. (a) Autoradiography (left) of functional NIS expression and immunohistochemistry (right) for MV-N antigen on the same tumor section. Scale bars = 1 mm. (b) Autoradiography of serial sections taken at 500 µmol/l intervals from primary and metastatic tumors collected at different times after infection. Quantification of the percentage injected dose of pertechnetate concentrated per gram of tissue (% ID/g) for each tumor is indicated in red at the bottom of each column. Scale bars above each column = 10 mm. (c) Localization of virus infection within harvested primary tumors (top panel) and examples of the concentric (O, outer; M, middle; I, inner) and threshold masks (bottom panel) applied to digitized images of each tumor section. Error bars indicate mean ± SD; n = 13 (Day 2), n = 17 (Day 5), n = 18 (Day 8), n = 18 (Day 12). Scale bars = 5 mm. (d) Primary tumor section obtained 12 days after IV inoculation of MVvac2NIS analyzed first by autoradiography (top left), then by Hoechst fluorescence (top right), and finally by H&E staining (bottom). Infected, perfused, and viable regions of the tumor are indicated by white arrows; a perfused, viable but uninfected region of tumor is indicated by one red arrow. Scale bars = 2 mm. (e) Comparison of primary (left) and metastatic (right) tumors from the same animal analyzed by autoradiography (top panels) and Hoechst staining (bottom panels) at day 2 after infection. Scale bars = 2 mm. IV, intravenously; MV, measles virus.

