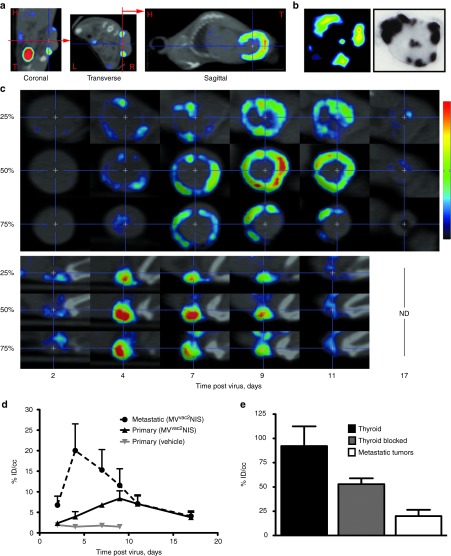
Figure 5.
High-resolution SPECT/CT quantifies virus infection in primary and metastatic tumors from the same animal. (a) Image analysis following U-SPECTII/CT imaging, illustrating vertical alignment of primary tumor bases in the coronal and transverse planes to obtain autoradiography-equivalent images from the sagittal plane. H, head; T, tail; L, left; R, right. (b) Comparison of an individual primary tumor analyzed first by U-SPECTII/CT and subsequently harvested and analyzed by autoradiography. (c) Serial images in the sagittal plane of a primary tumor (top) and metastatic tumor (bottom) from the same animal at multiple time points following IV administration of MVvac2NIS. Images from different depths within the same tumor are shown; the relative position of each image within the total tumor depth is indicated on the left. (d) Quantification of isotope uptake within primary and metastatic tumors from the same animals at multiple time points after MVvac2NIS IV administration. Data are given as mean ± SD; n = 5 (MVvac2NIS, metastatic and primary), n = 1 (vehicle). (e) Comparison of pertechnetate uptake within murine thyroid pharmacologically blocked or not with L-thyroxine and peak metastatic tumor uptake on day 4 after infection with IV MVvac2NIS. Data are given as mean ± SD; n = 5 (metastatic tumor), n = 6 (blocked thyroid), n = 2 (thyroid). IV, intravenously; MV, measles virus; SPECT, single photon emission computed tomography.

