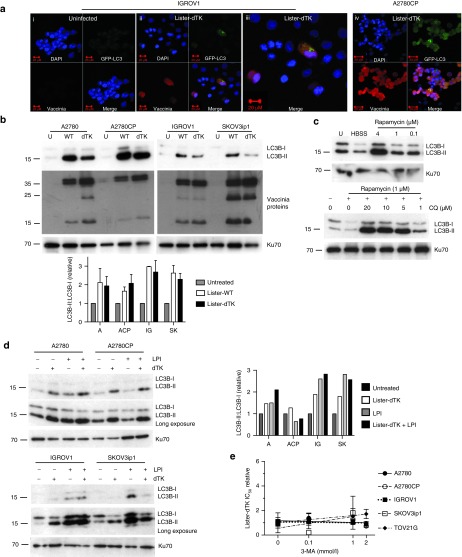
Figure 3.
Vaccinia does not require autophagy for cytotoxicity. (a) LC3B localization in IGROV1 (i–iii) and A2780CP (iv) cells. Cells were co-infected with Ad GFP-LC3 (MOI 30) and Lister-dTK (MOI 1) and imaged 72 hours postinfection. (iii) is a magnified image from (ii). (b) Appearance of LC3B-II following infection with Lister-wt (WT) or Lister-dTK (dTK; both MOI 1). Protein was extracted 72 hours postinfection and subjected to SDS-electrophoresis. Representative blot of three experiments is shown. Quantification (below) of three independent experiments shows the mean ± SEM LC3B-II:LC3B-I relative expression. (c) Upper blot: accumulation of LC3B-II in A2780CP cells following 24 hours of serum starvation (lane 2, HBSS treatment) or treatment with the rapamycin. Lower blot: accumulation of LC3B-II in A2780 cells following 24 hours treatment with both rapamycin and chloroquine. (d) Lysosomal turnover of LC3B-II. Cells were infected with Lister-dTK (MOI 1) in the presence or absence of lysosomal protease inhibitors (LPI) pepstatin A (10 µg/ml) and E64d (10 µg/ml) for 72 hours. Protein was subjected to SDS-electrophoresis. Bar graph (right) shows quantification of LC3B-II:LC3B-I relative expression. (e) IC50 of Lister-dTK in the presence of the autophagy inhibitor 3-methyladenine relative to the IC50 of Lister-dTK alone. Cell survival was determined by MTS assay and represents the mean ± SD relative IC50. Lines present linear regression of the four IC50 values—the line slope does not differ significantly from 0 in any of the analyses. HBSS, Hanks buffered salt solution.

