Figure 5.
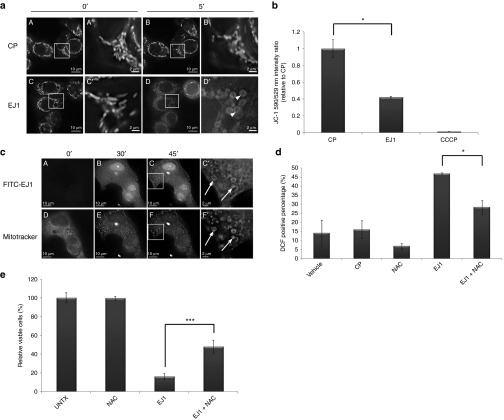
EJ1 peptide localizes to the mitochondria and causes mitochondrial disruption and ROS generation. (a) MDA-MB-468 cells were incubated in serum-free media with 200 nmol/l MitoTracker Red CMXRos and 5 μg/ml Hoechst 33342 nuclear stain, followed by either 20 μmol/l CP (A–B') or 20 μmol/l EJ1 (C–D'), and imaged at 0 minutes (A, A' and C, C') or at 5 minutes (B, B' and D, D'). (b) MDA-MB-468 cells were incubated with 1 μmol/l JC-1, followed by 20 μmol/l CP, 20 μmol/l EJ1, or 50 μmol/l CCCP. Results were calculated as the ratio of the 514/590 nm to 514/529 nm fluorescences and the ratio for CP-treated sample was set as 1. *P < 0.05, Student's t-test. Error bars, mean ± SD. (c) T47D cells were treated with MitoTracker (shown in D–F and F') and Hoechst 33342 as in (a) and incubated with 20 μmol/l FITC-labeled EJ1 (shown in A–C and C'). (d) MDA-MB-468 cells were stained with 10 μmol/l DCFH-DA, followed by water (Vehicle), 20 μmol/l CP, 0.5 mmol/l NAC, and 20 μmol/l EJ1 or EJ1 in combination with NAC. Cells were then sorted by flow cytometer and analyzed by Cellquest Pro 4.0 software. The results are expressed as the percentage of DCFH fluorescence–positive cells. *P < 0.05, Student's t-test. Error bars, mean ± SD. (e) MDA-MB-468 cells were treated with 0.5 mmol/l NAC alone, 20 μmol/l EJ1 alone, or NAC in combination with EJ1, and viability was assayed by the MTT assay. ***P < 0.001, Student's t-test. Error bars, mean ± SD.

