. 2013 Nov 18;18(11):110504. doi: 10.1117/1.JBO.18.11.110504

Fig. 3.

Fig. 3

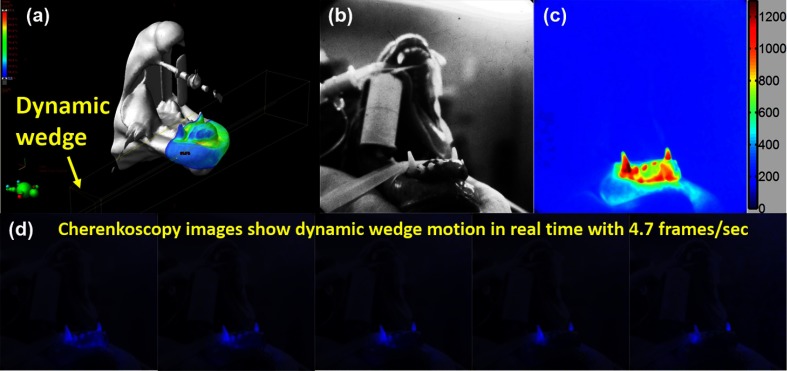
(a) The treatment plan shows incident of the beam and dynamic wedge. Surface dose was calculated by the treatment planning system (Eclipse) and mapped on the surface of the treatment region. (b) Field view of the treatment region from the gated ICCD system. (c) Cherenkoscopy of the treatment region while irradiation progresses. (d) Cherenkoscopy overlaid on the white-light images of the treatment field and sequence of Cherenkoscopy showing the beam field changing while a wedge is moved into the beam to shape the integrated dose on the field. (Video 1, MOV, 19.5 MB) [URL: http://dx.doi.org/10.1117/1.JBO.18.11.110504.1].