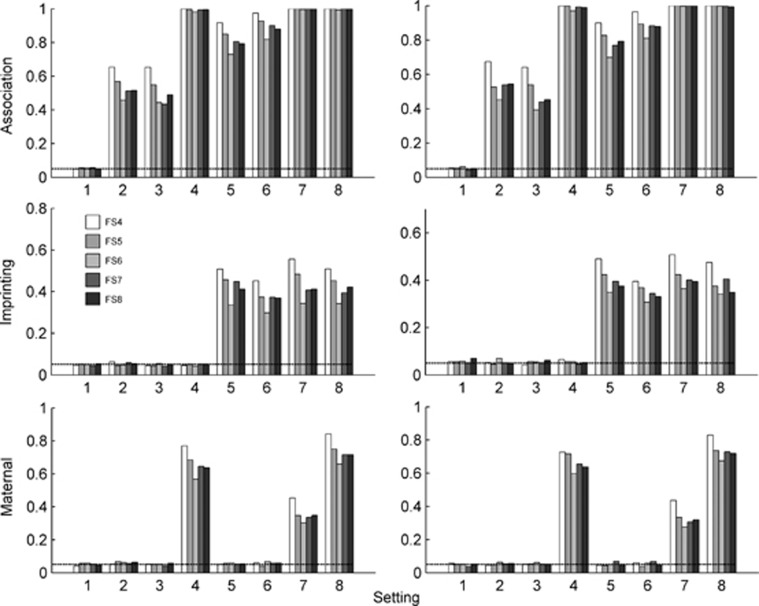
Figure 2.
Type I error rate and power of LIME having family samples FS4–FS8. FS4: 150 case-2 siblings-parents and 150 control-parents families. FS5: 150 case-sibling-parents and 150 control-parents families. FS6: 150 case-parents and 150 control-parents families. FS7: 200 case-parents and 150 control-parents families. FS8: 175 case-parents and 175 control-parents families. In the left panel, neither AE nor MS holds, and in the right panel, both AE and MS hold. The prevalence is 0.15. The X-axis represents the eight simulation settings of relative risks given in Table 3. The horizontal line marks the nominal α level of 0.05.

