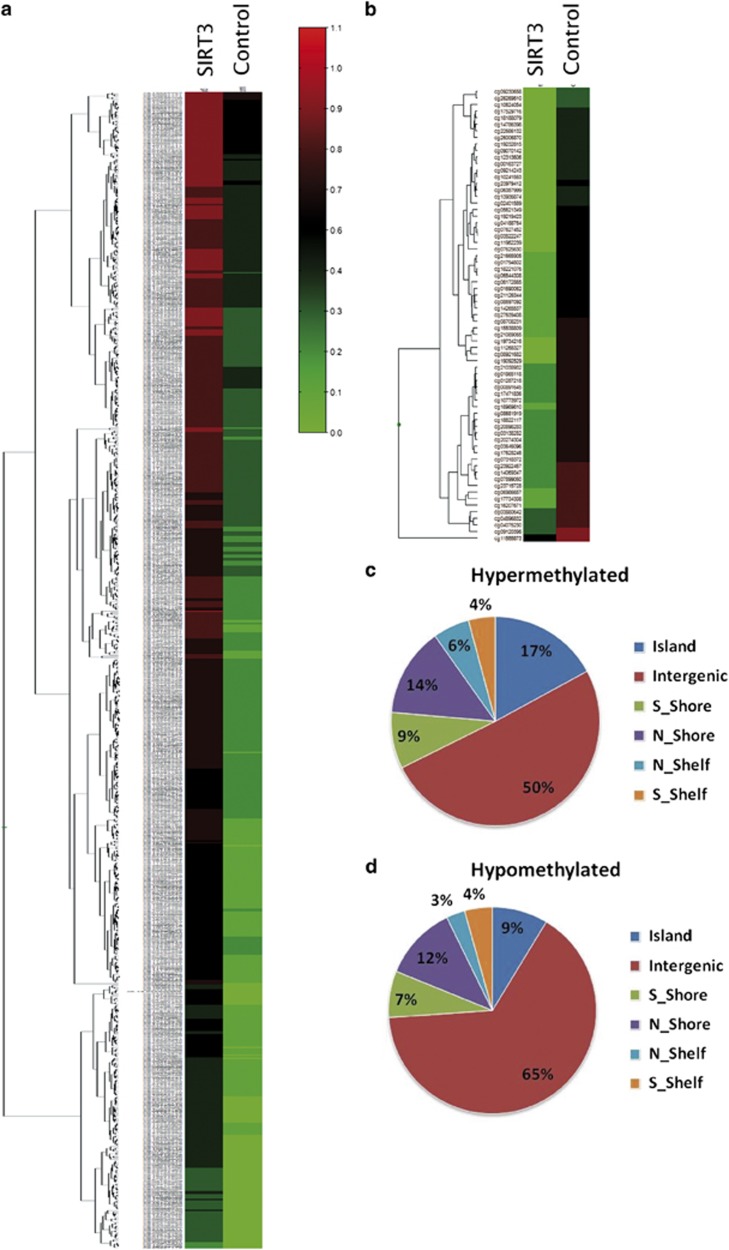
Figure 4.
SIRT3 overexpression induces hypermethylation in the 8MG glioma-derived cell line. Methylation profiles of bisulphite-treated and -untreated samples from SIRT3-overexpressing cells (SIRT3) and GFP-overexpressing cells (Control) were analysed using the 450K Infinium methylation bead arrays (see Subjects and methods). The figure presents the heatmap of significant probes using beta values; the scale indicates the level of methylation, from 0 (no methylation, green) to 1 (100% methylation, red). (a) CpG sites hypermethylated in SIRT3-overexpressing cells. (b) CpG sites hypomethylated in SIRT3-overexpressing cells. (c) Distribution of CpG sites hypermethylated in SIRT3-overexpressing cells. (d) Distribution of CpG sites hypomethylated in SIRT3-overexpressing cells.

