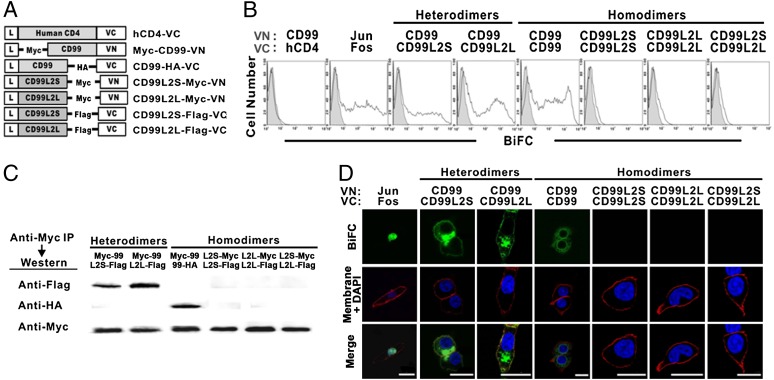
FIGURE 1.
Characterization of the interaction between mCD99 and mCD99L2. (A) Diagram of the DNA constructs for the expression of mCD99 or mCD99L2 proteins tagged with Myc, Flag, or HA epitopes and fused with the VN or VC gene. (B) Flow cytometry was used to evaluate fluorescence emission from the BiFC complex. After HEK293 cells were transfected with different combinations of VN and VC constructs for determining heterodimer formation between mCD99 and mCD99L2 proteins, cells were analyzed by flow cytometry for fluorescence emitted by BiFC complexes. Gray-filled histograms represent fluorescence emitted by cells transfected with VN construct only. (C) Physical interaction between mCD99 and mCD99L2 proteins. Proteins were pulled down from the lysates of HEK293 cells transfected with various combinations of VN and VC constructs using an anti-Myc Ab and were probed using anti-Flag, anti-Myc, or anti-HA Abs followed by HRP-conjugated goat anti-mouse IgG. (D) Localization of BiFC complexes. To localize BiFC complexes (green), transfected cells were stained with DAPI (blue) and DiI (red) to visualize nuclei and the plasma membrane, respectively, and the cells were observed under a TCS-SP2 confocal microscope (original magnification ×630). Data were processed using LCS Lite software (Leica). Scale bar, 5 μm. All the data (A–D) represent more than five independent experiments.

