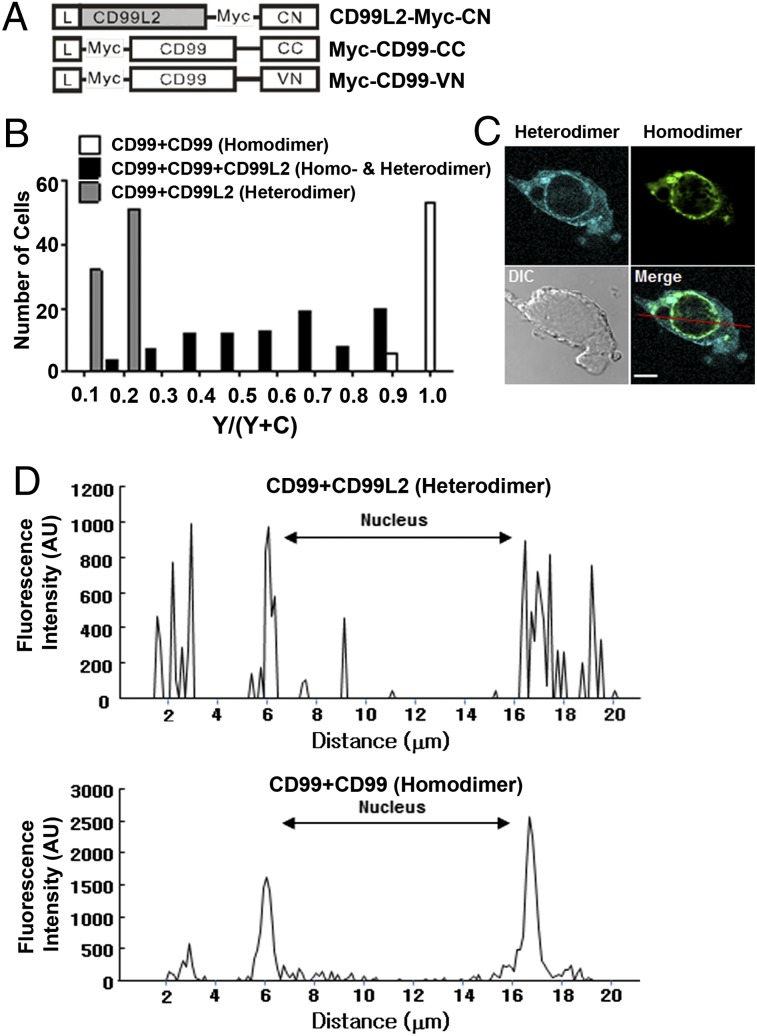
FIGURE 3.
Coexistence of mCD99-mCD99L2 hetero- and mCD99-mCD99 homodimers. To verify whether mCD99 and mCD99L2 compete to form dimers, two-color BiFC assays were performed. (A) Diagram of the DNA constructs used for the expression of mCD99 or mCD99L2 proteins fused with VN, CC, or CN. (B) Plot of cell numbers versus relative YFP values. HEK293 cells were transfected with different combinations of VN, CC, and CN constructs for testing hetero- and homodimer formation between mCD99 and mCD99L2 proteins. CFP and YFP intensities were quantified using a 436/470 nm “C” filter and a 500/535 nm “Y” filter of a TCS-SP2 scanning confocal microscope, and the YFP/(YFP + CFP) ratios versus cell numbers were plotted in the histogram. Data were processed with LCS Lite software. (C) Representative confocal image of homodimeric YFP and heterodimeric CFP localization within a transfected cell 48 h after transfection. CFP and YFP from the BiFC complexes were detected at the 476 and 527 nm emission wavelengths, respectively, using a FluoView 1000 confocal microscope (original magnification ×1000). The red line on the merged image indicates the line of measurement for the fluorescence intensity of homo- and heterodimers. The gamma setting did not need to be changed to adjust the images. Scale bar, 5 μm. (D) Fluorescence intensity of each dimer. Fluorescence intensity from the merged cell image (C) was measured as the area under the curve representing the nucleus or other regions using FV10-ASW 3.0 Viewer software (Olympus). Representative data from more than five independent experiments are shown (A–D).

