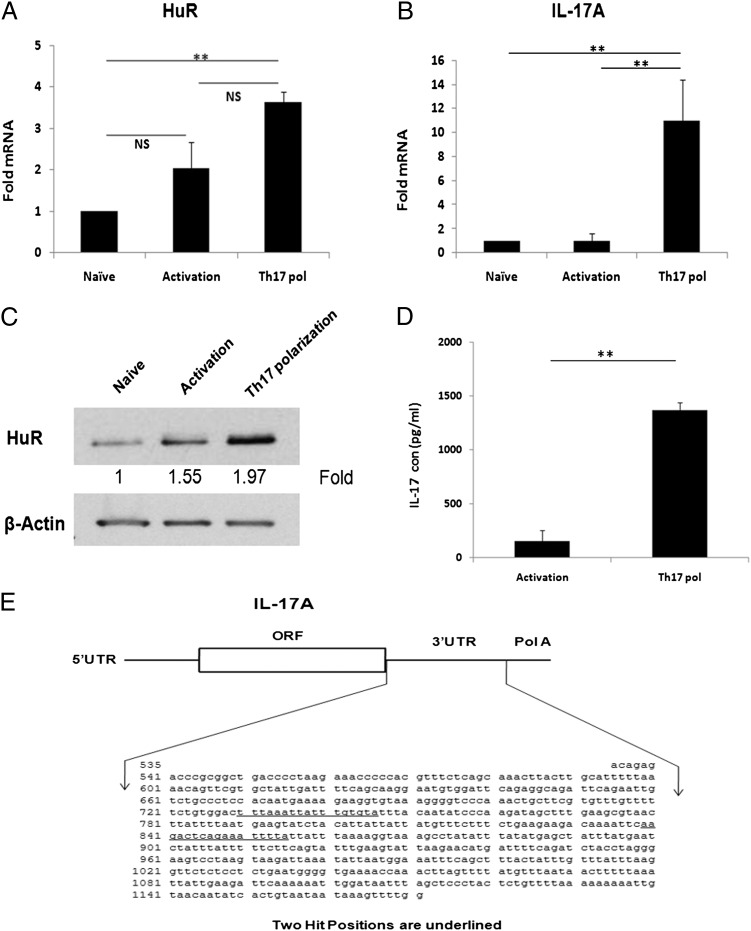
FIGURE 1.
Analysis of HuR expression in CD4+ T cells. CD4+ T cells were isolated from spleen of naive WT mice. Cells were stimulated with plate-coated anti-CD3 (10 μg/ml) plus anti-CD28 (3 μg/ml) (activation) or in the presence of Th17 cell–polarizing cytokines for 4 d according to the methods described. (A and B) Total RNA was isolated from activated and Th17-polarized cells and reversely transcribed into cDNA. The mRNA levels of HuR and IL-17 were analyzed by real-time RT-PCR. (C) Cells were lysed with triple-detergent lysis buffer, and HuR protein expression was analyzed by Western blotting (top panel) using β-actin as a loading control (bottom panel). (D) Cell-culture supernatant was collected, and IL-17 cytokine levels were measured by ELISA. (E) Schematic representation of IL-17 3′ UTR. Two predicted HuR binding sites are underlined in 3′ UTR of IL-17 mRNA. Data were presented as mean ± SEM. Data in (A)–(D) were derived from at least three independent experiments. **p < 0.001.

