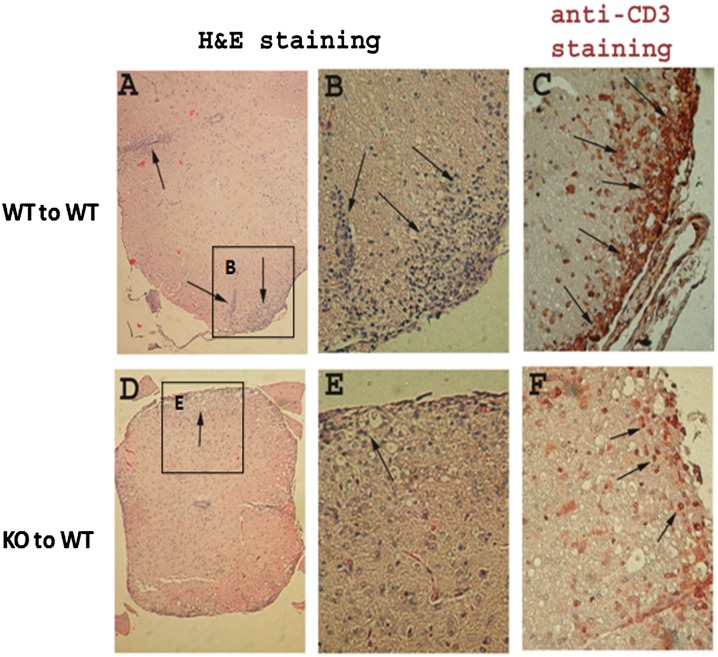
FIGURE 7.
Histopathology of spinal cords of mice with EAE. Spinal cords were obtained from recipients that received WT (A–C) or HuR KO CD4+ T cells (D–F) at ∼21 d after cell transfer. Representative H&E staining of spinal cord sections (A, B, D, and E) and anti-CD3 immunohistochemical staining of spinal cord sections (C, F) are shown. There are higher numbers of inflammatory cellular infiltrates of spinal cords in mice that received WT CD4+ T cells (A–C) than those that received HuR KO CD4+ T cells (D–F). Staining is representative of four pairs of mice. Original magnification in (A) and (D) is ×100; in (B), (C), (E), and (F), ×400. Arrows point to areas of cellular infiltration. Insets in (A) and (D) are enlarged to full size in (B) and (E), respectively.

