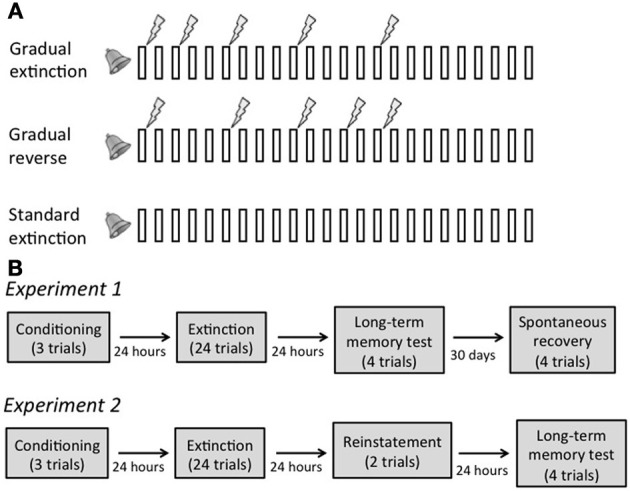
Figure 1.

(A) Schematic of the extinction phase in each extinction condition. Bars represent 20 s tone presentations; lightning bolts represent 500 ms 0.7 mA foot shocks. Note that temporal relations between the stimuli are depicted for illustration only, and are not to scale. (B) Design of Experiments 1 and 2.
