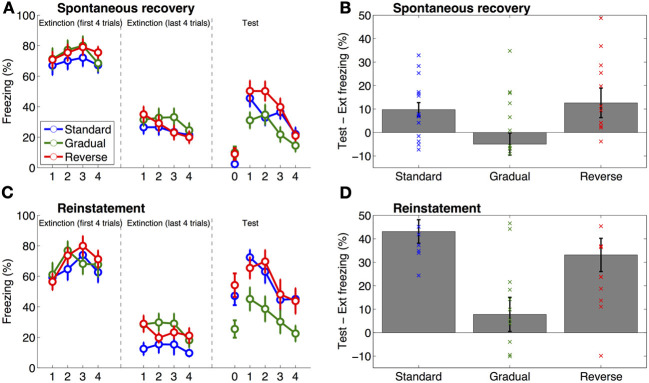
Figure 2.
Results of Experiments 1 and 2. The left panels (A,C) show freezing on the first and last 4 trials of extinction and at test (the same data are summarized in Table 1), the right panels (B,D) show the difference score (% freezing) between the test phase and the end of extinction (i.e., freezing during the 4 trials of the test phase minus freezing during the last 4 trials of extinction), with individual data superimposed on the group means. Time point “0” indicates pre-tone freezing. Error bars represent standard error of the mean. (A,B) Results of Experiment 1, in which animals were tested for spontaneous recovery of fear 1 month after extinction. Freezing at test was greater than freezing on the last four trials of extinction (Ext) in the Standard and Gradual Reverse groups as compared to the Gradual group. (C,D) Results of Experiment 2, in which animals were exposed to 2 unsignaled shocks 24 h after extinction, followed by a reinstatement test 24 h later. On the reinstatement test the Standard and Gradual Reverse groups froze significantly more than the Gradual group.

