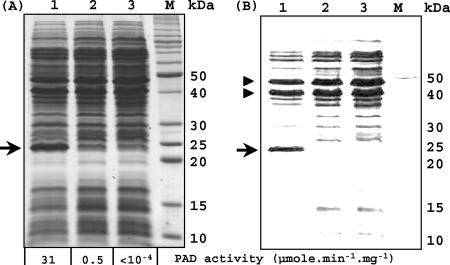
FIG. 3.
(A) SDS-PAGE of crude protein extracts from noninduced (lane 3) and 2.4 mM p-coumaric acid-induced (lane 2) LPNC8 cells and from the noninduced LPNC8ΔR mutant (lane 1). M, SDS-PAGE molecular mass standards (Invitrogen). Arrow indicates the protein band corresponding to the constitutively overexpressed PadA enzyme in the LPNC8ΔR mutant. (B) Identical to panel A, with a simple increase in brightness and contrast to enable evaluation of the relative concentration of PadA in the LPNC8ΔR mutant compared to the concentrations of the other two main protein bands (indicated by arrowheads) that are constitutively expressed in the wild-type and mutant strains.

