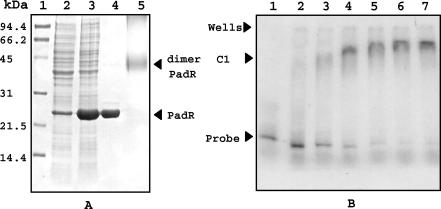
FIG. 5.
Overexpression, purification, and mobility shift assays with purified PadR. (A) SDS-PAGE analysis of crude extracts and purified His-tagged PadR from E. coli BL21(DE3) carrying the pER plasmid. Lane 1, molecular mass standards; lane 2, crude protein extract from noninduced E. coli; lane 3, crude protein extract from 1 mM IPTG-induced E. coli; lane 4, PadR purified by Ni-NTA affinity chromatography; lane 5, purified PadR treated with 10 mM glutaraldehyde. Dimer PadR, protein band corresponding to the putative dimerized purified PadR with a molecular mass of about 45 kDa. (B) Mobility shift assays of the DNA probe corresponding to the padA promoter region, generated and labeled by PCR amplification with [α-32P]dATP, with or without purified PadR. Lane 1, probe (3 × 10⁻⁷ M pad promoter DNA) without protein; lanes 2 to 7, probes with increasing concentrations of purified PadR (lane 2, 10−6 M; lane 3, 2 × 10⁻⁶ M; lane 4, 3 × 10⁻⁶ M; lane 5, 4 × 10⁻⁶ M; lane 6, 5 × 10⁻⁶ M; lane 7, 6 × 10⁻⁶ M).

