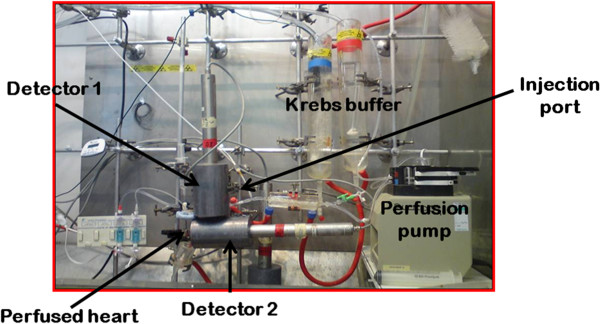
Figure 1.

Experimental set-up. In each experiment, a bolus of [18 F]-FDG or [18 F]-FMISO was injected through the injection port, and its passage through the perfusion line was recorded using two NaI γ-detectors which are able to measure the input (detector 1) and the tissue (detector 2) time-activity curves.
