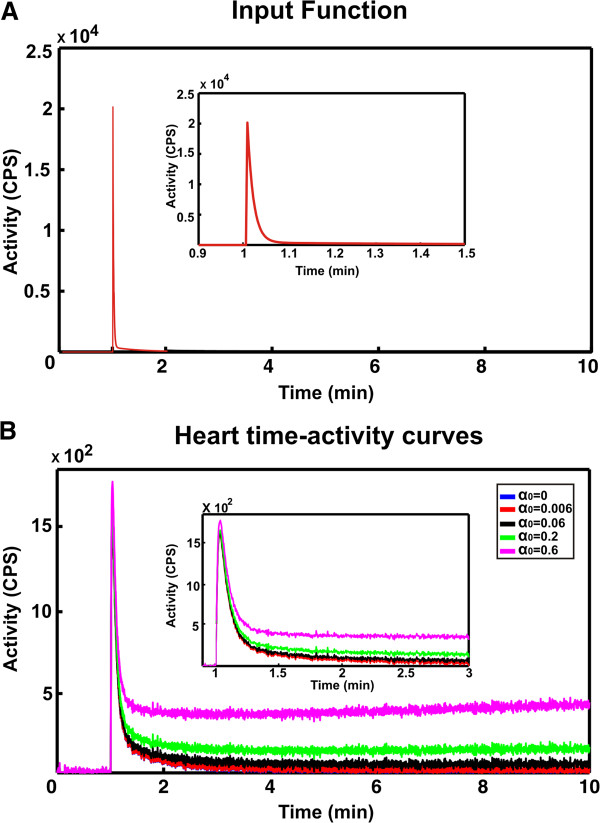
Figure 2.
Simulated datasets. (A) Representative input function used in the simulations. (B) Representative simulated heart time-activity curves for different values of irreversible trapping components (α0). The dynamics simulated were chosen to mimic the tissue time-activity curves of hypoxia-sensitive tracers characterised by an increase in tracer uptake when the perfused heart is made hypoxic compared to that measure in normoxia.

