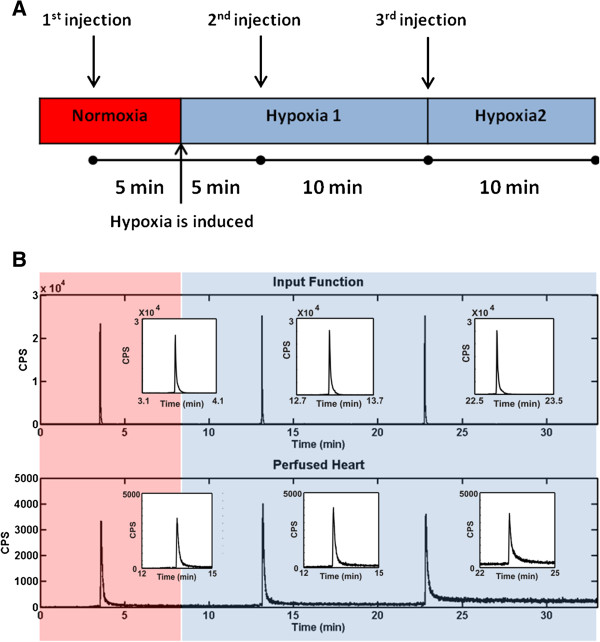
Figure 3.
Experimental protocol. (A) Schematic representation of the experimental protocol used to acquire [18 F]-FDG and [18 F]-FMISO ex vivo time-activity curves from perfused rat hearts. After a stabilisation period, where the KHB perfusate was gassed with 95% O2-5% CO2, the first bolus of either [18 F]-FDG or [18 F]-FMISO was injected into the perfusion line. After 5 min, hypoxia was induced by switching to a second reservoir with KHB gassed with 95% N2-5% CO2. Further boli of each tracer were then injected into the system after 5 min and 15 min of hypoxic buffer perfusion, respectively. (B) Representative [18 F]-FDG input and tissue time-activity curves acquired ex vivo using the protocol described in (A) (y-axis units are counts per second).

