
Figure 8.
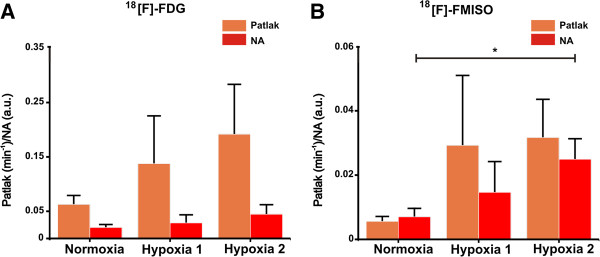
Calculated values of Patlak and NA for experimental datasets. Mean ± SD of Patlak (orange) and NA (red) in normoxia and hypoxia for (A) [18 F]-FDG and (B) [18 F]-FMISO experimental time-activity curve acquired ex vivo from perfused rat hearts. *p < 0.05.