
Table 1.
Structures and activities of compounds in the training and internal test sets.
 | |||||||
|---|---|---|---|---|---|---|---|
| Cmpd. | Ref. | R1 | R2 | IC50 (µM)a | pIC50 | EC50 (µM)b | pEC50 |
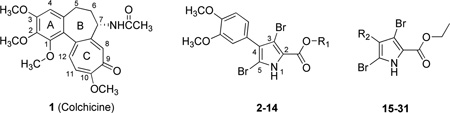
| 1† | 16 | N/A | N/A | 0.014 | 7.70 | 0.03 | 7.52 |
| 2† | 16 | Et | — | 0.036 | 7.44 | 0.49 | 6.31 |
| 3 | 16 | Me | — | 0.618 | 6.21 | 5.0 | 5.30 |
| 4* | 16 | n-Pr | — | 0.067 | 7.17 | 3.3c | 5.48 |
| 5 | 16 | i-Pr | — | 0.109 | 6.96 | 3.6c | 5.44 |
| 6 | 16 | t-Bu | — | 1.8 | 5.74 | 25c | 4.60 |
| 7† | 16 | n-Bu | — | 1.3 | 5.89 | 33c | 4.48 |
| 8 | 16 | n-Hex | — | 3.3 | 5.48 | 14c | 4.85 |
| 9 | 16 | Benzyl | — | 5.3 | 5.28 | 100d | 4.00 |
| 10 | 16 | -(CH2)3NMe2 | — | 4.6 | 5.34 | 50c | 4.30 |
| 11 | 16 | -(CH2)2NMe2 | — | 5.2 | 5.28 | 50c | 4.30 |
| 12 | 16 | -(CH2)3NMe2H+Cl− | — | 8.0 | 5.10 | 100d | 4.00 |
| 13 | 16 | -(CH2)2NMe2H+Cl− | — | 11 | 4.97 | 100d | 4.00 |
| 14* | 16 | 4-MeOPh | — | 18 | 4.74 | 100d | 4.00 |
| 15 | 15 | — | Ph | 10 | 4.99 | 167c | 3.78 |
| 16* | 15 | — | 4-MePh | 2.2 | 5.65 | 75c | 4.12 |
| 17 | 15 | — | 4-ClPh | 0.919 | 6.04 | 83c | 4.08 |
| 18 | 15 | — | 4-BrPh | 0.312 | 6.51 | 94c | 4.03 |
| 19 | 15 | — | 4-MeOPh | 0.843 | 6.07 | 7.0 | 5.15 |
| 20 | 15 | — | 3-MeOPh | 0.633 | 6.20 | 2.4 | 5.62 |
| 21 | 15 | — | 3,4,5-(MeO)3Ph | 13 | 4.89 | 71c | 4.15 |
| 22 | 15 | — | 2-Br-4,5-(MeO)2Ph | 2.6 | 5.58 | 14 | 4.85 |
| 23 | 15 | — | 1-Napthyl | 3.2 | 5.49 | 7.0 | 5.15 |
| 24* | 15 | — | 3-Indolyl | 2.0 | 5.70 | 18 | 4.75 |
| 25 | 15 | — | 4-CF3OPh | 1.7 | 5.77 | 27 | 4.57 |
| 26 | 15 | — | 4-MeSPh | 0.626 | 6.20 | 19 | 4.73 |
| 27 | 15 | — | 3,4-Cl2Ph | 0.806 | 6.09 | 9.9 | 5.00 |
| 28 | 15 | — | 3-F-4-MeOPh | 0.539 | 6.27 | 14 | 4.85 |
| 29 | 15 | — | 6-EtO-2-Napthyl | 2.0 | 5.70 | 33c | 4.48 |
| 30 | 15 | — | 1,3-Benzodioxol-6- | 1.8 | 5.74 | 30 | 4.53 |
| 31* | 15 | — | 1,4-Benzodioxan-6- | 4.4 | 5.36 | 21 | 4.68 |
 | |||||||||
|---|---|---|---|---|---|---|---|---|---|
| Cmpd. | Ref. | R3 | R4 | R5 | R6 | IC50 (µM)a | pIC50 | EC50 (µM)b | pEC50 |
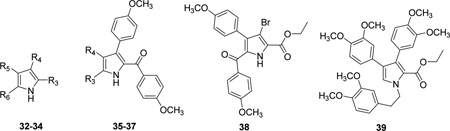
| 32 | 17 | CO2Et | H | 4-MeOPh | Cl | 5.0 | 5.30 | 75c | 4.12 |
| 33 | 17 | 4-MeOPhCO | 4-MeOPh | CO2Et | H | 100e | 4.00 | 500d | 3.30 |
| 34 | 17 | CO2Et | 4-MeOPh | 4-MeOPh | H | 100e | 4.00 | 500d | 3.30 |
| 35 | 17 | CO2Et | H | — | — | 3.0 | 5.52 | 100c | 4.00 |
| 36 | 17 | CO2Et | 4-MeOPh | — | — | 100e | 4.00 | 500d | 3.30 |
| 37 | 17 | 4-MeOPhCO | 4-MeOPh | — | — | 100 | 4.00 | 500d | 3.30 |
| 38* | 17 | — | — | — | — | 100e | 4.00 | 500d | 3.30 |
| 39 | 17 | — | — | — | — | 100e | 4.00 | 500d | 3.30 |
 | |||||||||
|---|---|---|---|---|---|---|---|---|---|
| Cmpd. | Ref. | R7 | IC50 (µM)a | pIC50 | EC50 (µM)b | pEC50 | |||
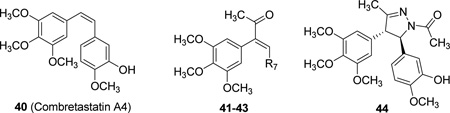
| 40† | 22 | — | 0.003 | 8.52 | 0.007 | 8.15 | |||
| 41 | 23 | 4-MeOPh | 0.35 | 6.46 | 18.6 | 4.73 | |||
| 42 | 23 | 4-MePh | 0.095 | 7.02 | 5.6 | 5.25 | |||
| 43 | 23 | 3-OH-4-MeOPh | 0.182 | 6.74 | 1.8 | 5.74 | |||
| 44* | 21 | — | 0.900 | 6.06 | 4.5 | 5.35 | |||
 | |||||||||
|---|---|---|---|---|---|---|---|---|---|
| Cmpd. | Ref. | R8 | R9 | R10 | R11 | IC50 (µM)a | pIC50 | EC50 (µM)b | pEC50 |
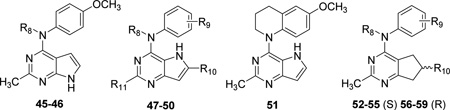
| 45* | 26 | Me | — | — | — | 0.183 | 6.74 | 5.8 | 5.24 |
| 46 | 26 | H | — | — | — | 20f | 4.70 | 80f | 4.10 |
| 47 | 24 | Me | 4-MeO | H | Me | 0.097 | 7.02 | 1.2 | 5.92 |
| 48 | 24 | Me | 4-MeO | H | H | 0.193 | 6.71 | 1.4 | 5.85 |
| 49 | 24 | Me | 4-MeO | Me | Me | 0.030 | 7.52 | 0.22 | 6.66 |
| 50 | 24 | Me | 4-MeO | Me | NH2 | 0.298 | 6.53 | 8.4 | 5.08 |
| 51* | 24 | — | — | — | — | 0.043 | 7.37 | 0.23 | 6.64 |
| 52 (S)† | 25 | Me | 4-MeO | Me | — | 0.012 | 7.92 | 0.023 | 7.64 |
| 53 (S)g | 26 | H | 4-MeO | Me | — | 12f | 4.92 | 43f | 4.37 |
| 54 (S)g | 26 | Me | 3-MeO | Me | — | 0.095 | 7.02 | 1.6 | 5.80 |
| 55 (S)g | 26 | Me | H | Me | — | 1.67 | 5.78 | 43f | 4.37 |
| 56 (R) | 25 | Me | 4-MeO | Me | — | 0.051 | 7.29 | 0.278 | 6.56 |
| 57 (R)g | 26 | H | 4-MeO | Me | — | 51f | 4.29 | 520f | 3.28 |
| 58 (R)g | 26 | Me | 3-MeO | Me | — | 0.402 | 6.40 | 6.9 | 5.16 |
| 59 | 26 | Me | H | Me | — | 7.1 | 5.15 | 520f | 3.28 |
Member of internal test set.
Compound used as structural prototype for family.
IC50s are antiproliferative activities tested using human MDA-MB-435 cancer cells; pIC50 = −log(IC50).
Loss of interphase microtubules evaluated in A-10 cells.
Depolymerization results reported as x% microtubule loss at y µM; value here is 50 y / x, which assumes a linear relationship between EC50 and cell loss.
Literature reports no microtubule loss up to 10 or 50 µM; we assume 5% loss at 10 or 50 µM and the EC50 is calculated using the relation of note c.
In these compounds, no microtubule effect (EC50) was observed up to 50 µM, and the measured IC50, if any, was assumed to arise from another antiproliferative mechanism; thus IC50s were arbitrarily assigned to be 100 µM.
Literature report was IC50 or EC50 > 10 or 40 µM, assuming 25% loss at 10 or 40 µM using relation of note c.
The activities reported are for racemic mixtures. The IC50 and EC50 ratios of compounds 53, 54 and 55 (the R enantiomers) to compounds 57, 58 and 59 (the S enantiomers) were assumed to be the same as the experimentally determined IC50 and EC50 ratios of compound 52 (R) to compound 56 (S).