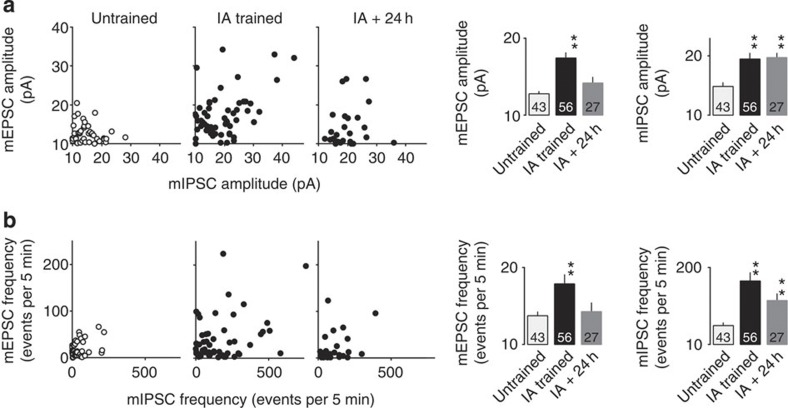
Figure 8. The increase of inhibitory synaptic responses were maintained for more than 24 h after IA learning task.
(a) Plots of the mEPSC and mIPSC amplitudes in untrained, IA trained and 24 h after the IA-trained rats. Twenty-four hours after learning, significant increase in mIPSC amplitude was still observed (**P<0.0001 versus untrained, untrained: n=43, IA trained: n=56, IA trained+24 h: n=27, one-way factorial ANOVA followed by post hoc analysis with the Fisher’s PLSD test), whereas the mEPSC amplitude declined to the basal level (P=0.125). (b) Plots of the mEPSC and mIPSC frequency in untrained, IA trained and 24 h after the IA-trained rats. Twenty-four hours after learning, significant increase in mIPSC frequency was still observed (**P=0.0003 versus untrained, untrained: n=43, IA trained: n=56, IA trained+24 h: n=27, one-way factorial ANOVA followed by post hoc analysis with the Fisher’s PLSD test), whereas the mEPSC frequency declined to the basal level (P=0.637). The number of cells in each group is shown at the bottom of each bar. Error bars indicate ±s.e.m.

