Figure 6.
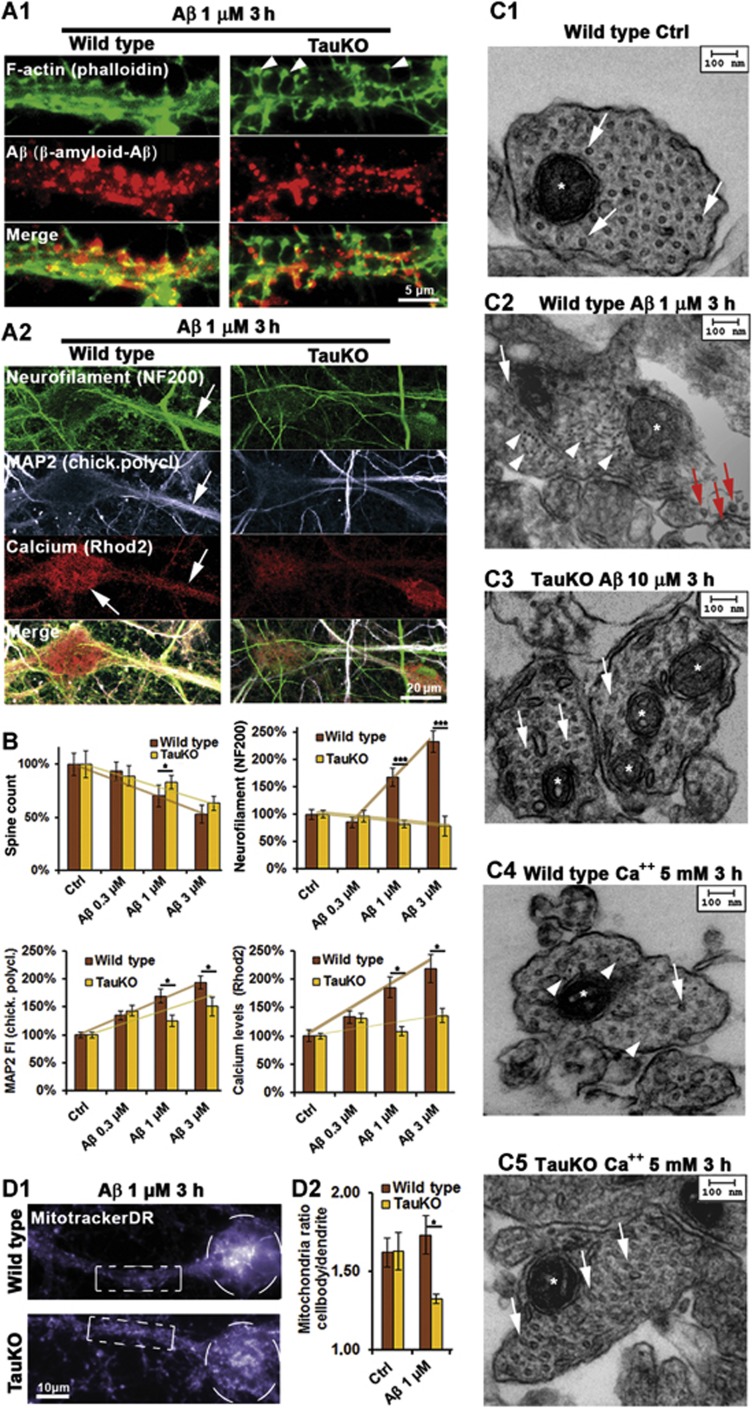
Tau deficiency does not protect against Aβ association to dendrites and transient spine loss, but protects against loss of MTs, neurofilament invasion, and loss of mitochondria. Primary wild-type (wt) and TauKO hippocampal neurons aged 19–20DIV. (A1) Three hours after exposure to Aβ, Aβ staining shows solid association with dendrites of both wt and TauKO cells (middle panels). Dendritic spine number (upper panels) is reduced in both cases, arrowheads indicate remaining spines in the case of TauKO neurons (right panels). (A2) Left panels: treatment of wt cells results in strong somatodendritic missorting of neurofilaments and increase in Ca++ and MAP2 (arrows). Right panels: treatment of TauKO cells with Aβ does not result in missorting of neurofilaments. MAP2 and Ca++ are only slightly elevated. (B) Quantifications of (A1) and (A2). Upper left panel: quantification of (A1) reveals a trend to more stable spines in the case of TauKO cells. Upper right panel: only wt cells show neurofilament invasion. Lower panels: wt cells show a dose-dependent increase in dendritic MAP2 and Ca++ levels, while there is only a slight increase in TauKO cells. (C) Electron microscopy of thin cross-sections of wt and TauKO hippocampal dendrites of cells treated with AβO or Ca++ as indicated. Stars indicate mitochondria. (C1) Control dendrites show a dense packing of MTs (arrows) and no neurofilaments. (C2, C4) Wt dendrites show loss of MTs in the dendrites (indicated by arrows), but not in axons (red arrows, c2), and neurofilament invasion (arrowheads). (C3, C5) TauKO neurons do not show MT loss after exposure to Aβ or Ca++ and no neurofilament invasion. (D) Cells were treated with Aβ for 3 h and stained for mitochondria. (D1) After exposure to Aβ, in wt cells (upper panel) mitochondria are cluster in the cell body (circle) and are lost in the dendrite (box), while in TauKO cells (lower panel) mitochondria density is similar in the cell body (circle) and the dendrite (box). (D2) Quantification of the ratio of mitochondria staining in the soma versus dendrite reveals clustering of mitochondria in the cell body in the case of wt neurons, whereas in TauKO neurons mitochondria are reduced in the soma and elevated in the dendrite.

