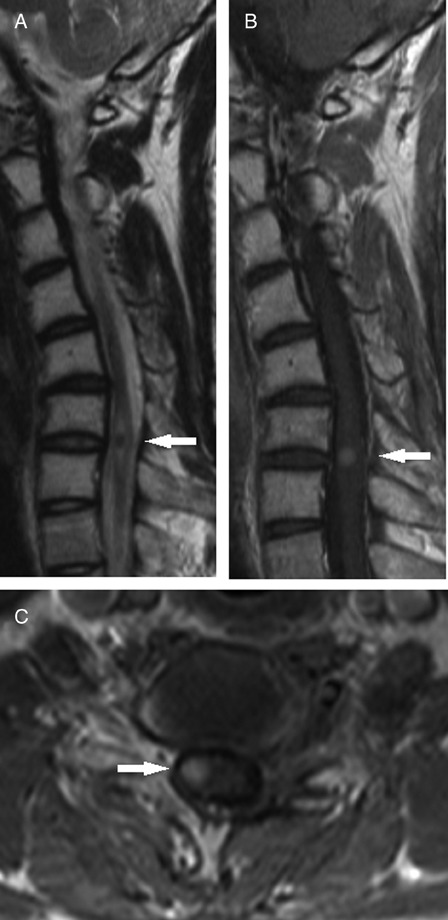
Figure 3.

Magnetic resonance imaging scan of the intramedullary mass causing expansion of the cord and edema over several segments. T2-weighted image showing a spinal cord tumor (arrow) that is surrounded by perifocal edema and has an isointense signal (A). Sagittal (B) and axial (C) T1-weighted post-contrast images showing intense and uniform enhancement of a well-circumscribed intramedullary mass (arrow).
