
Figure 5.
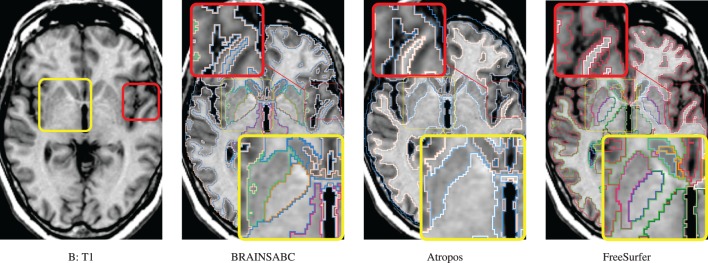
Visual Comparison of Scan B in Table 2. Tissue classification results from three applications, BRAINSABC, Atropos of ANTS Tools, and FreeSurfer on top of T1-weighted images, uni-modal processing. This subject present relatively small tissue ratio, reflecting brain atrophy progression to some extent. Again, Atropos were more parsimonious in the subcortical (yellow box) GM identification than others. Red box also underlines differences of tissue classifications on the cortical area. Note that without T2 modality, CSF classification results of BRAINSABC were more agreeable to the other two.