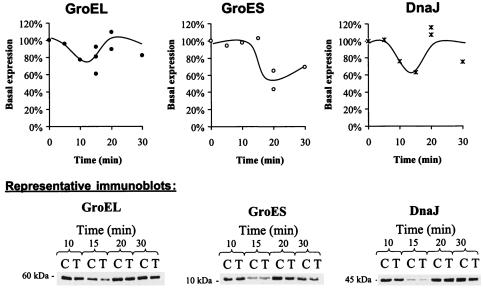
FIG. 3.
Expression levels of GroEL, GroES, and DnaJ in L. monocytogenes OSY-8578 after sublethal treatment with PEF at 15 kV/cm for 29 μs and incubation at 25°C for 5 to 30 min. Symbols: •, GroEL; ○, GroES; ×, DnaJ. In the representative immunoblots, C represents the control culture and T represents the PEF-treated samples.

