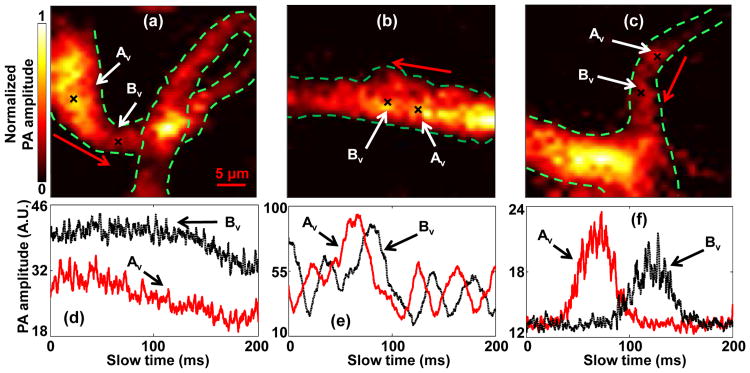
Fig. 4.
In vivo blood flow measurements in vessels with different structures. Black crosses denote locations of the two measurement spots. Red arrows denote the flow direction. PA images of (a) a loop vessel, (b) a straight vessel, and (c) a vessel bifurcation. (d-f) Time courses of slow-time PA profiles from Av and Bv in (a-c), respectively.

