Fig. 1.
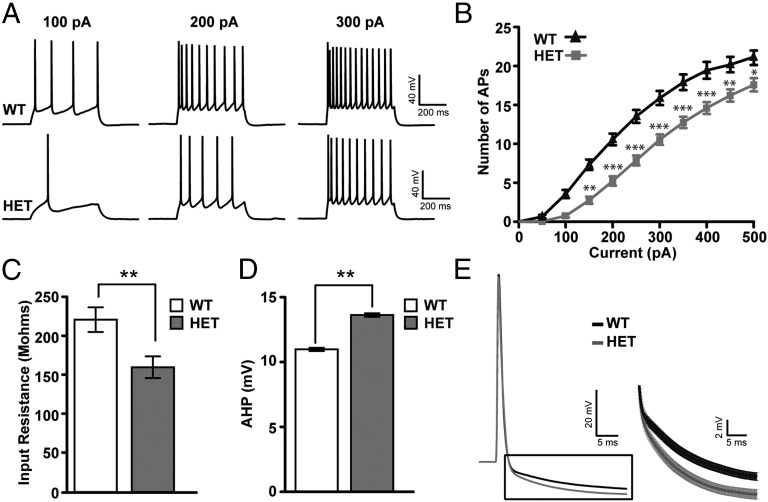
Intrinsic excitability is altered by Pten mutation. (A) Example voltage traces elicited by current injection in a L2/3 pyramidal neuron from a control and Pten heterozygote (HET) mouse in acute slice preparations. (B) Intensity–Frequency (I-F) plot in response to somatic current injection (10 steps of 50 pA, 500 ms duration) in control and Pten+/− (HET) neurons. Note the decreased firing rate in HET neurons. Two-way ANOVA test, Bonferroni post hoc test (*P < 0.05, **P < 0.01, ***P < 0.001). (C) Input resistance measured in pyramidal neurons of cortical slices taken from control (white bar) and HET (gray bar) mice. Note the decreased input resistance in HET neurons (Student t test, P = 0.0053). (D) Action potential after-hyperpolarization (AHP) measurements in control (white bar) and HET (gray bar) neurons. Note the increased AHP in HET neurons measured 25 ms after action potential onset (Student t test, P = 0.0045). (E) (Left) Action potential average (30 ms) from control (black trace) and HET (gray trace) neurons. (Right) Average of AHP traces from both genotypes. Note the increased AHP in the HET trace (gray) compared with control trace (black). In all traces, error bars indicate SEM.

