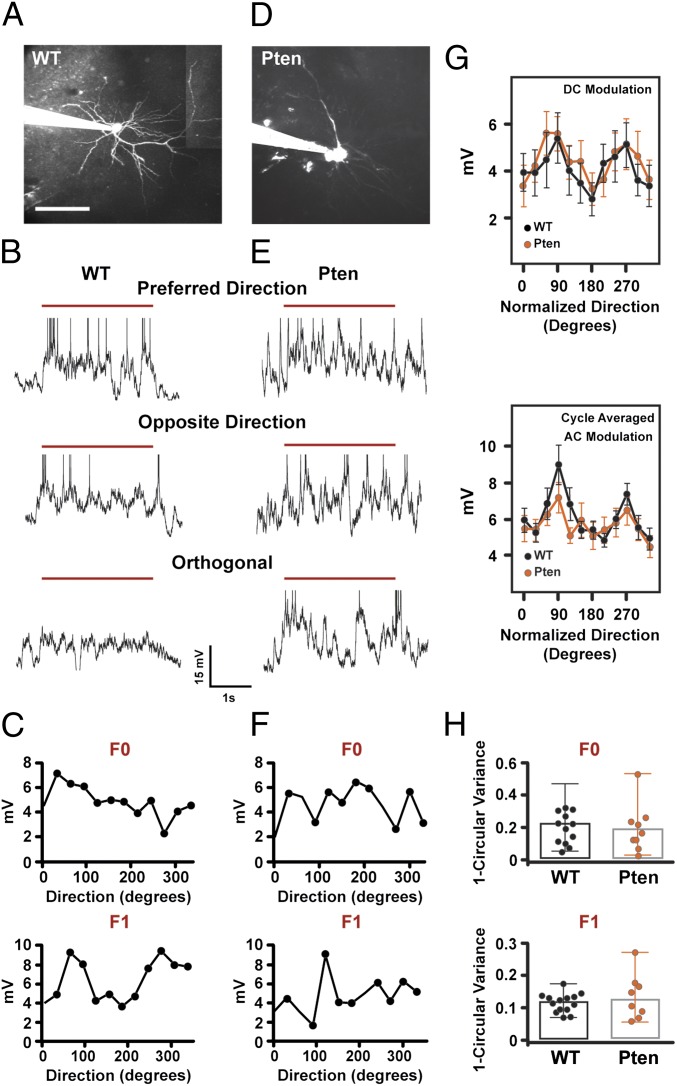
Fig. 4.
Tuning of evoked subthreshold membrane depolarization is unaffected by Pten mutation. (A and D) Maximum-intensity projection of a L2/3 pyramidal neuron from a control mouse (A) and Pten HET mouse (D) filled with Alexa 594 in whole-cell patch configuration and imaged with two-photon laser-scanning microscopy. The patch pipette is seen entering the image from the Left. (Scale bar, 100 μm.) (B and E) Single-trial membrane potential (MP) responses elicited by 3 s of visual stimulation with sine wave-drifting gratings (red line represents visual stimulus with the grating) at the preferred, opposite, and orthogonal direction from a whole-cell recording from a control (B) and Pten HET (E) L2/3 neuron. Spikes have been truncated for display purposes. (C and F) Average DC (F0) (Upper) and AC (F1) (Lower) modulation of the membrane potential for the control neuron (C) and the Pten HET neuron (F). (G) DC (F0) (Upper) and AC (F1) (Lower) modulation of subthreshold responses as a function of direction for control (black) and mutant (orange) neurons. Plots are mean and SE. Peak orientation is normalized to 90° for all cells. (H) Distribution of orientation selectivity indices for the DC (F0) (Upper) and AC (F1) (Lower) modulations for control and Pten mutant neurons. The bar shows the median OSI, and error bars represent the range.

