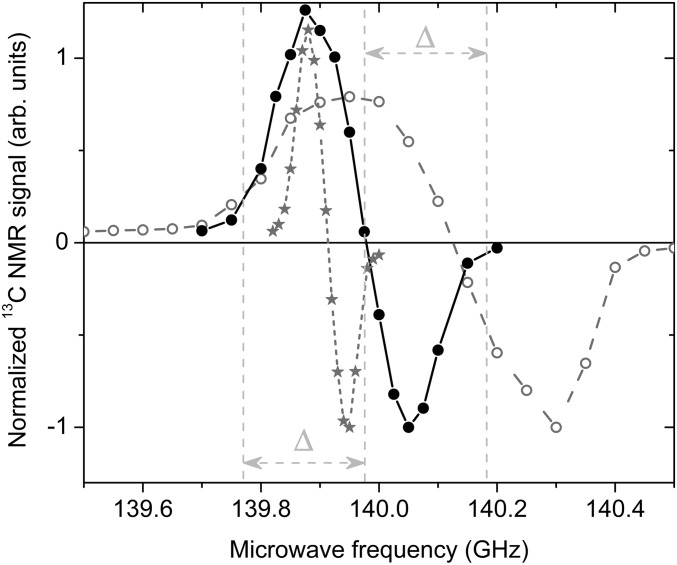
Fig. 3.
Microwave spectra at 5 T and 4.2 K. Comparison between the microwave spectra measured by 13C MR in UV-irradiated [1-13C]PA (full circles), [1-13C]PA doped with 16-mM OX063 trityl radicals (stars), and a frozen 3-M sodium [1-13C]pyruvate aqueous solution doped with 50 mM TEMPO nitroxyl radicals (open circles). The frequency separation Δ between the central and the left or right vertical dotted lines corresponds to the 1H MR frequency at 5 T.

