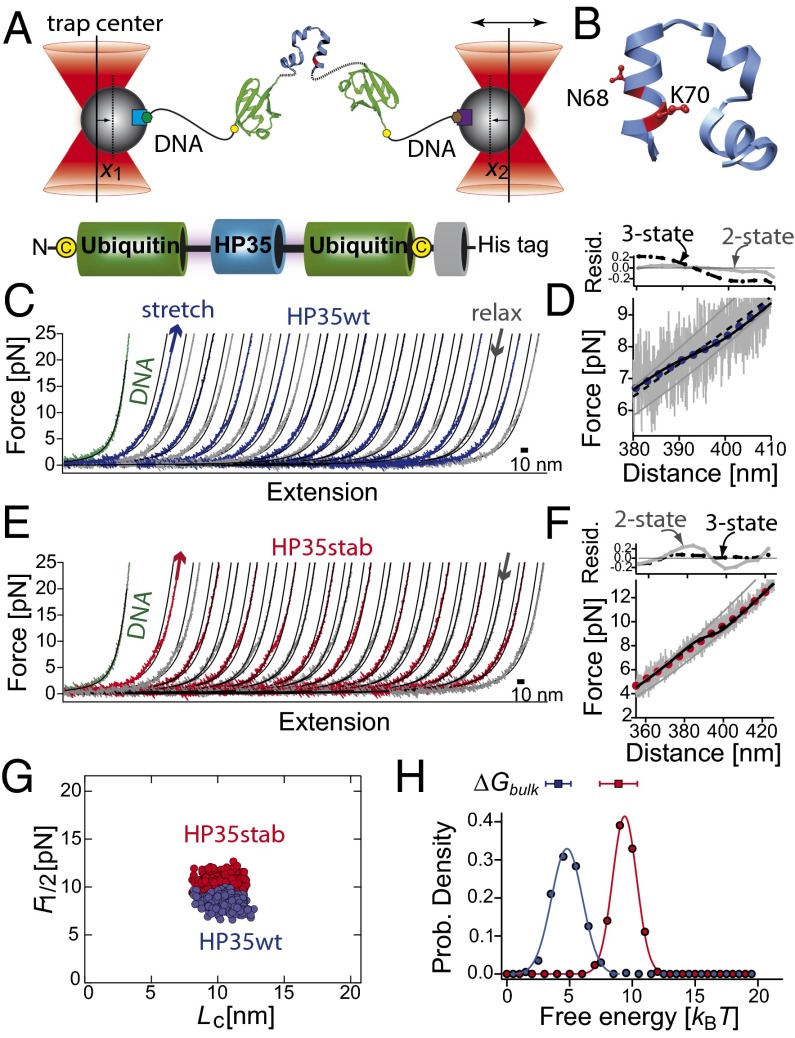
Fig. 1.
(A) Sketch of the experimental setup with the HP35 protein (blue) embedded within two copies of ubiquitin (green) and connected to DNA (black, biotin: green hexagon, digoxygenin: brown hexagon) handles attached to functionalized silica beads (beads gray, α-digoxygenin: purple square, streptavidin: light blue square). The terminal cysteine residues are shown as yellow dots. Total bead deflection is x(t) = x1(t) + x2(t). (B) Three-dimensional structure of the C-terminal subdomain HP35 as extracted from villin headpiece HP67 (PDB code 1yu5) (29). The residues N68 and K70 are shown in ball-and-stick representation. They are replaced by alanine and methionine in HP35stab. (C and E) Force-extension traces of consecutive stretch (blue) and relax (gray) cycles of HP35WT and of HP35stab (red–gray). The curves were filtered to 1 kHz. Solid lines are curve fits of a wormlike chain model to the data (SI Appendix). For comparison, stretching of the tethered DNA is shown as a green curve. (D and F) Force-distance trace of HP35WT at 20 kHz (gray lines) and filtered to 100 Hz (blue dots) and of HP35stab (gray–red). The solid gray lines are fits of the folded and unfolded states to an extensible wormlike chain model. Black solid lines are curve fits as obtained from an equilibrium unfolding model assuming a two-state model (SI Appendix). The dashed black line is a fit with a three-state model assuming unfolding of the protein in two steps with equal length and folding free energy (SI Appendix, Table S1). Residual plots for a two-state model (gray circles, gray solid line) and for a three-state model (black circles, black dashed line) are shown in Upper. (G) Scatterplot of the transition midpoint forces for HP35WT (blue dots, n = 445, < F1/2 ≥ 8.4 ± 0.6 pN) and HP35stab (red dots, n = 437, <F1/2 ≥ 10.3 ± 0.7 pN) versus contour-length increase (Lc). Data were obtained from force-extension curves of several single molecules and fits of an equilibrium folding model (SI Appendix, Eq. S9) to the data. (H) Distributions of the folding free energies for HP35WT (blue circles) and HP35stab (red circles). The solid curves passing through the points are fits to a Gaussian distribution function to guide the eye. The free energies from the chemical unfolding experiments are shown at the top of the graphs (SI Appendix, Table S1).

