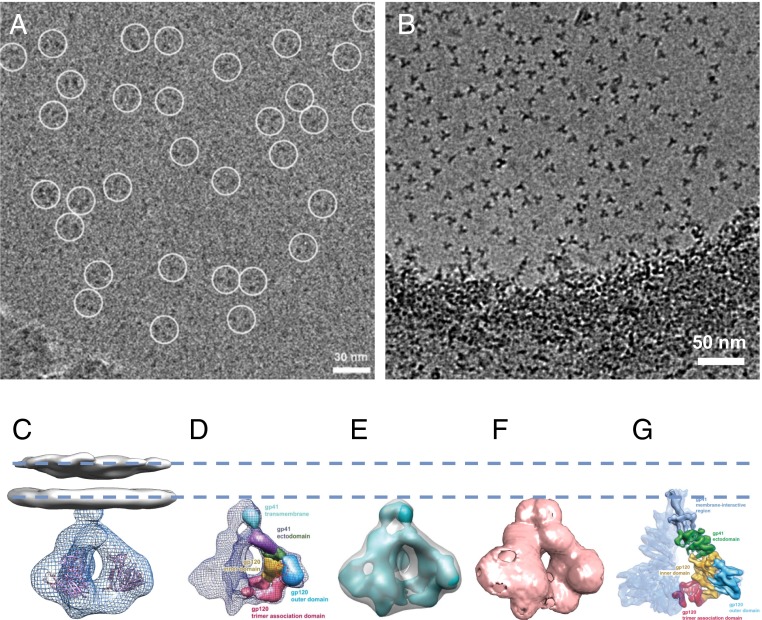
Fig. 1.
HIV-1 envelope glycoprotein structures determined by cryo-electron microscopy. (A) Electron micrograph presented in Mao et al. (1) with putative gp160 trimers circled. (B) For purposes of comparison, see the electron micrograph presented in Harris et al. (3) where the soluble Env trimers are clearly visible. The regions circled in the micrographs presented by Mao et al. (1) have a contrast similar to that of the background, raising doubts about the reliability of the particle selection process, which may have been done using a template. (C) Density map reported for native, cleaved trimeric HIV-1 Env at a resolution of ∼20 Å obtained from cryo-electron tomography of intact virions [from the work of Liu et al. (4)]. The map includes density for the ectodomain of HIV-1 Env (EMD-5019, mesh) and the lipid bilayer (EMD-5022, gray) shown with fitted coordinates for the gp120 protomer (Protein Data Bank ID code 3DNN). (D) Density map reported for uncleaved, detergent-solubilized trimeric HIV-1 Env at a resolution of ∼11 Å obtained by cryo-electron microscopy [from the work of Mao et al. (2)]. (E) Superposition of the map in D with the ectodomain of the map of native trimeric Env in C indicates that the region identified by Mao et al. (2) to be the transmembrane region corresponds to the base of the ectodomain region of the native Env reported by Liu et al. (4). (F) Inversion of the densities in EMD-5418 results in an outline that closely matches that of EMD-5019 shown in C. (G) Density map reported for uncleaved, detergent-solubilized trimeric HIV-1 Env at a resolution of ∼6 Å obtained by cryo-electron microscopy [from the work of Mao et al. (1)]. The dashed lines are drawn to provide a visual guide to the location of the lipid bilayer. A is reproduced from figure S1A of Mao et al. (1), and B is reproduced from figure 1C of Harris et al. (3). D and E are reprinted from Macmillan Publishers Ltd: Nature Structural & Molecular Biology (2), copyright 2012, and G is reproduced from figure 1 of Mao et al. (1).

