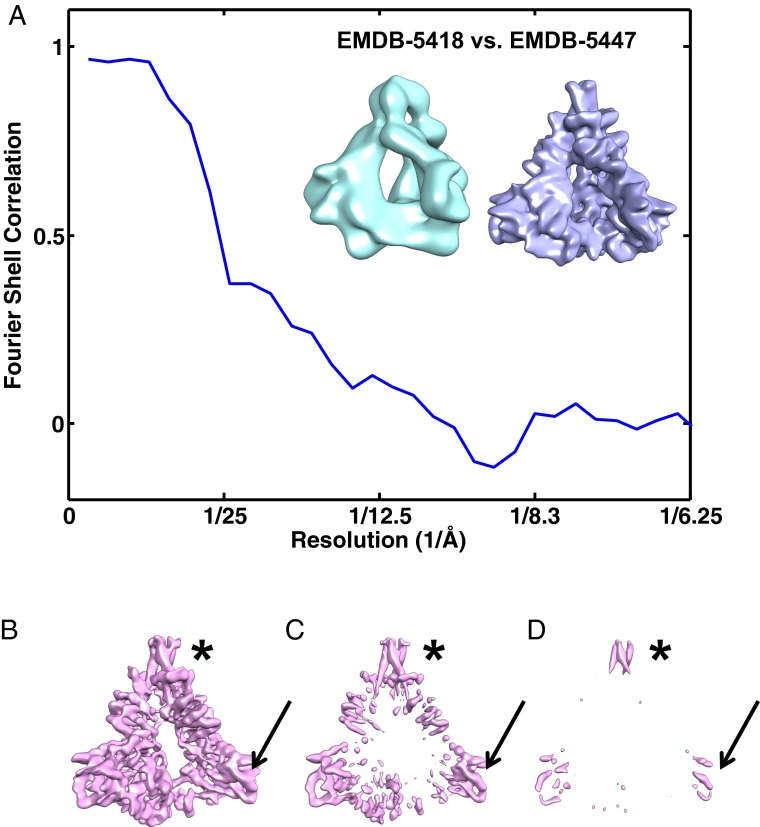
Fig. 2.
Comparison of the two maps reported by Mao et al. (1, 2). (A) Fourier shell correlation plot between density maps EMD-5418 (reported resolution ∼11 Å) and EMD-5447 (reported resolution ∼6 Å) indicating that the two maps are essentially uncorrelated beyond resolutions of ∼20 Å. (Inset) Comparison of EMD-5447 (filtered to a resolution of 11 Å) with EMD-5418 (reported to have a resolution of 11 Å) indicates that features in these two maps do not match. (B–D) Isosurface contours of EMD-5447 rendered using UCSF Chimera at three different thresholds (0.0074, 0.018, and 0.34 respectively) to determine the most ordered regions of the map. The asterisks and arrows point to the regions identified in Mao et al. (1) to correspond to the location of the gp41 transmembrane region and the V4 variable loop of gp120, respectively.

